Tauvid Injection, Solution
Product Images NDC 0002-1220

7 FDA label images from Eli Lilly And Company · Packaging, Regulatory Labels, and Product Appearance

Product Visual Gallery

This gallery contains 7 technical images submitted to the FDA as part of the official labeling for Tauvid (NDC 0002-1220). Unlike standard consumer photos, these assets often include clinical data figures, molecular chemical structures, and official manufacturer packaging layouts.

As provided by Eli Lilly And Company, these visuals offer a comprehensive scientific overview of the product's physical and chemical identity, aiding pharmacists and researchers in product verification and study.

FDA Label Image

Tauvid 100mci Shield Nl00

Tauvid 100mci Shield Nl00
Label for TAUVID (Flortaucipir F-18) Injection, a sterile intravenous solution in a 50 mL multiple-dose vial. The label shows concentration ranges from 300 MBq/mL to 3,700 MBq/mL (8.1 mCi/mL to 100 mCi/mL) at end of synthesis, with usage and storage instructions. Manufactured by PETNET Solutions for Eli Lilly and Company.*
FDA Label Image

Tauvid 51mci Shield 010 00

Tauvid 51mci Shield 010 00
Label for Tauvid (Flortaucipir F 18) Injection, solution for intravenous use, showing a 50 mL multiple-dose vial. The label indicates radioactive material caution, strength range from 300 MBq/mL to 1,900 MBq/mL (8.1 mCi/mL to 51 mCi/mL) at end of synthesis, and manufacturer details for Eli Lilly and Company via PETNET Solutions.*
FDA Label Image

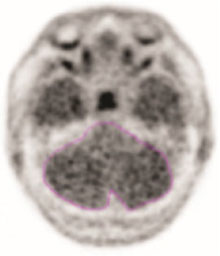
Figure 1 (Tauvid Uspi F1 V1)

Figure 1 (Tauvid Uspi F1 V1)
A grayscale brain scan image showing a horizontal cross-section of the brain. The scan highlights anatomical structures with a faint purple outline around a section in the lower middle portion, likely indicating an area of interest or measurement region.*
FDA Label Image

Tauvid Uspi F2 V2

Tauvid Uspi F2 V2
A side-by-side pair of brain scan images showing two different color scales for visualization. The left image uses a grayscale with a vertical multi-color scale bar, and the right image uses a vivid color scale from blue to red to represent varying intensities. Both images have crosshairs marking brain areas labeled ALT, AMT, PLT, and PMT.*
FDA Label Image

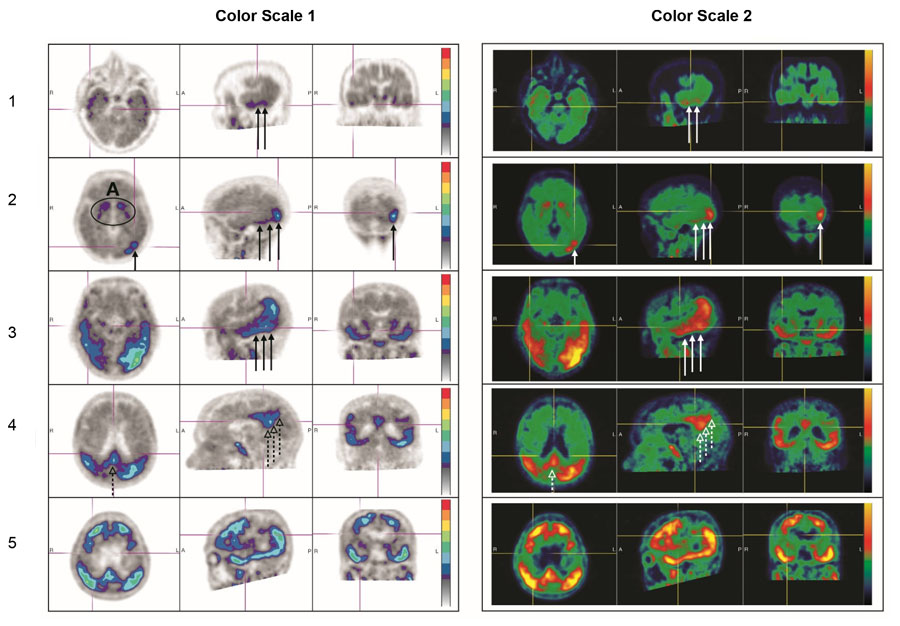
Figure 3 (Tauvid Uspi F3 V1)

Figure 3 (Tauvid Uspi F3 V1)
A comparative brain imaging chart showing two color scales side-by-side, labeled Color Scale 1 and Color Scale 2, across five rows with axial, sagittal, and coronal views. The images illustrate different intensity patterns in brain regions using gradations of color to indicate activity or tracer uptake, likely related to flortaucipir F-18 PET scans.*
FDA Label Image

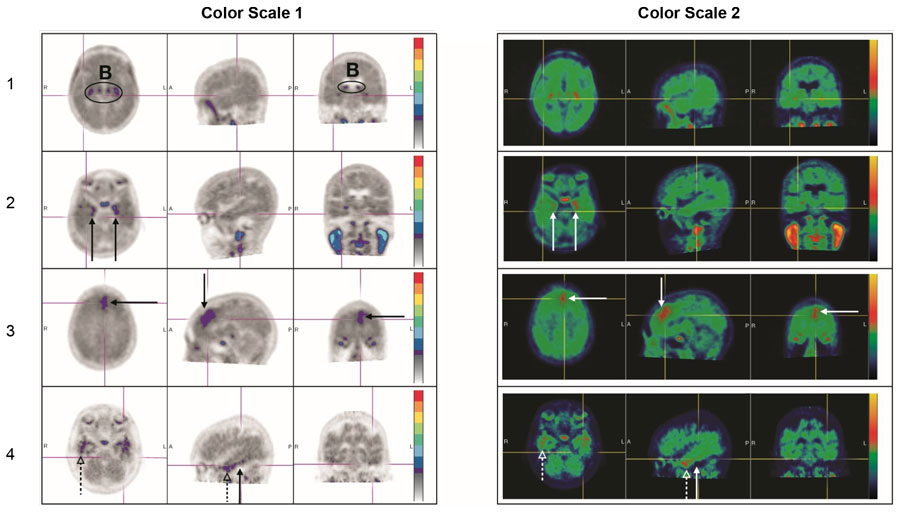
Figure 4 (Tauvid Uspi F4 V1)

Figure 4 (Tauvid Uspi F4 V1)
Two sets of brain scan images labeled Color Scale 1 and Color Scale 2 showing transverse, sagittal, and coronal views with colored overlays indicating areas of varying intensity. Each set consists of four rows with arrows and markings highlighting specific regions, with adjoining vertical color scales indicating the intensity gradient.*
FDA Label Image

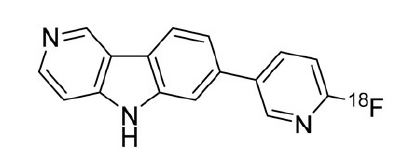
Structural Formula (Tauvid Uspi F5 V1)

Structural Formula (Tauvid Uspi F5 V1)
Chemical structure of Flortaucipir F-18, the active ingredient in TAUVID injection. The diagram shows a multi-ring molecular structure with a fluorine-18 isotope labeled on a pyridine ring.*

* About these descriptions: Image descriptions on this page are generated by automated AI analysis of the product label images from the manufacturer's FDA label submission (SPL). They are provided for reference only and may contain errors or omissions. Always rely on the printed label itself and the official FDA labeling, and consult a pharmacist or healthcare professional with any questions about this product.