Zepbound Injection, Solution
Product Images NDC 0002-2002
View Photos of Packaging, Regulatory Labels, and Product Appearance
Product Visual Gallery
This gallery contains 25 technical images submitted to the FDA as part of the official labeling for Zepbound (NDC 0002-2002). Unlike standard consumer photos, these assets often include clinical data figures, molecular chemical structures, and official manufacturer packaging layouts.
As provided by Eli Lilly And Company, these visuals offer a comprehensive scientific overview of the product's physical and chemical identity, aiding pharmacists and researchers in product verification and study.
Product Images & Figures Index
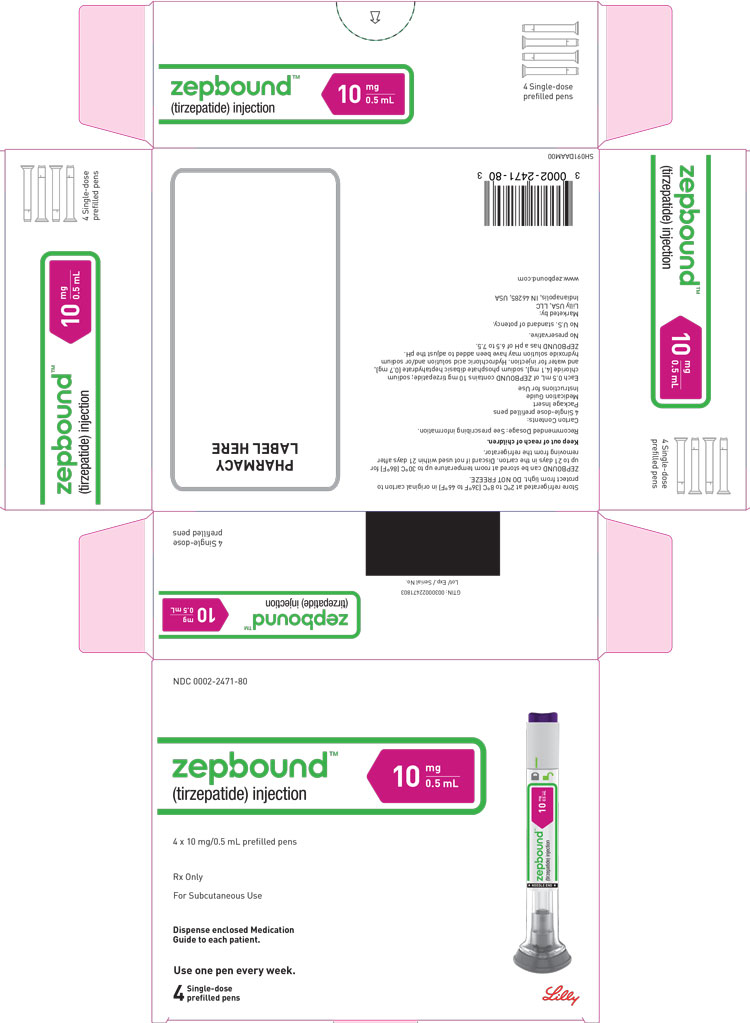
Package Label (Zepbound™, 10 mg/0.5 mL, Carton, 4 Single-Dose Pens)
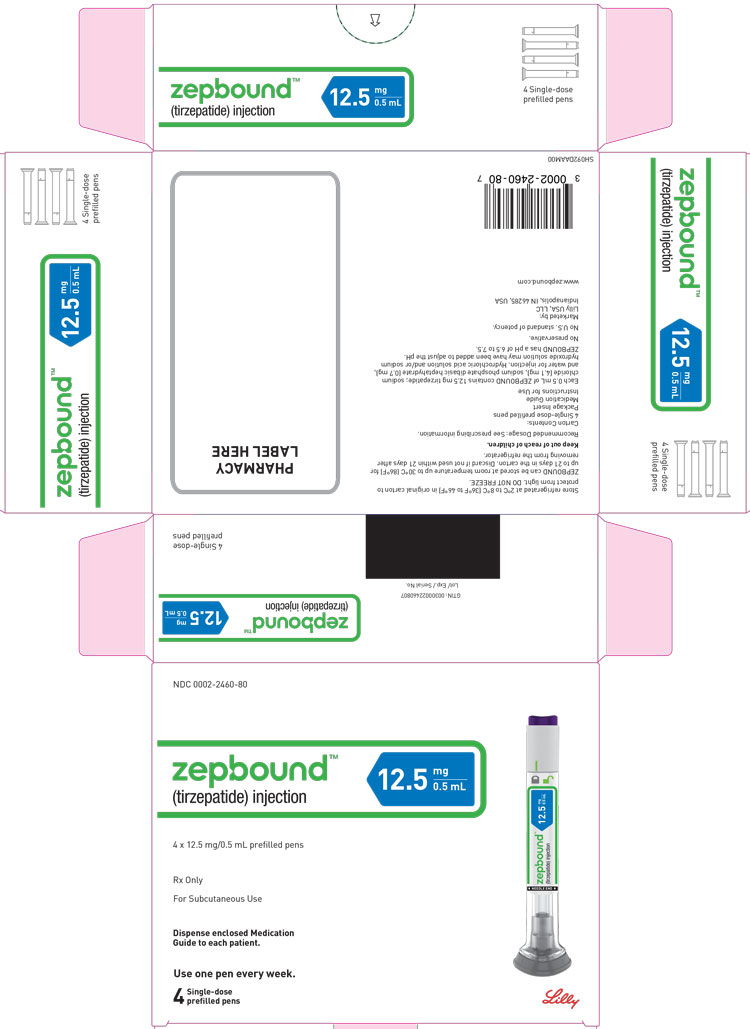
Package Label (Zepbound™, 12.5 mg/0.5 mL, Carton, 4 Single-Dose Pens)
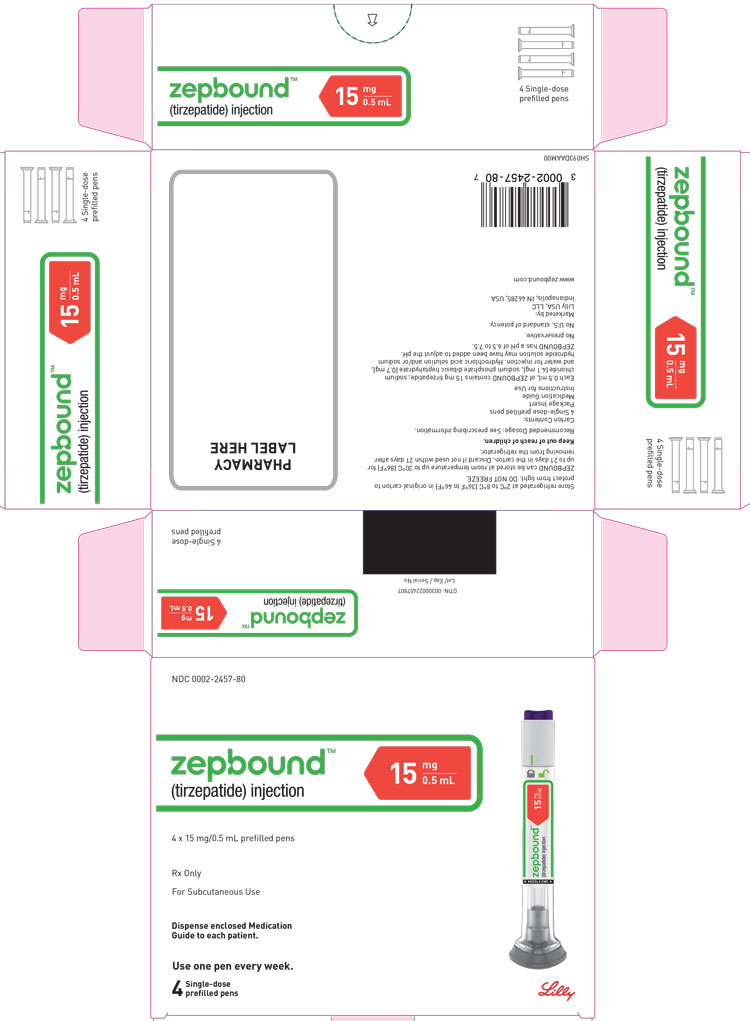
Package Label (Zepbound™, 15 mg/0.5 mL, Carton, 4 Single-Dose Pens)
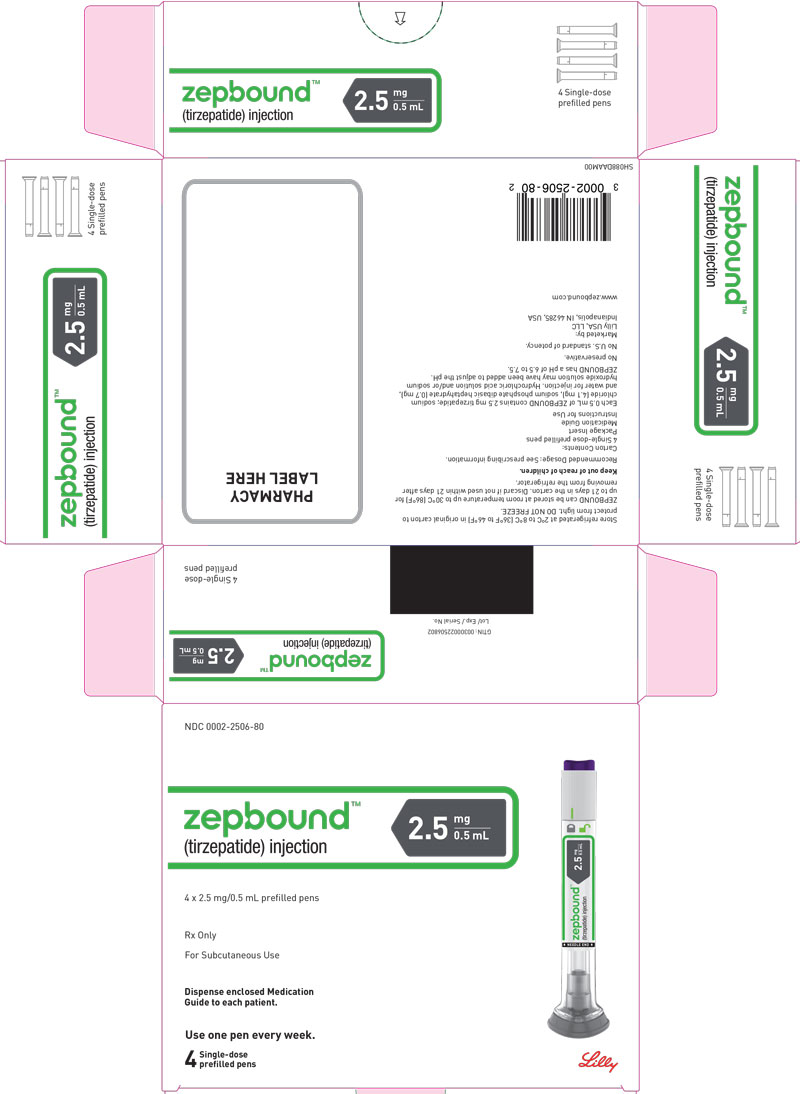
Package Label (Zepbound™, 2.5 mg/0.5 mL, Carton, 4 Single-Dose Pens)
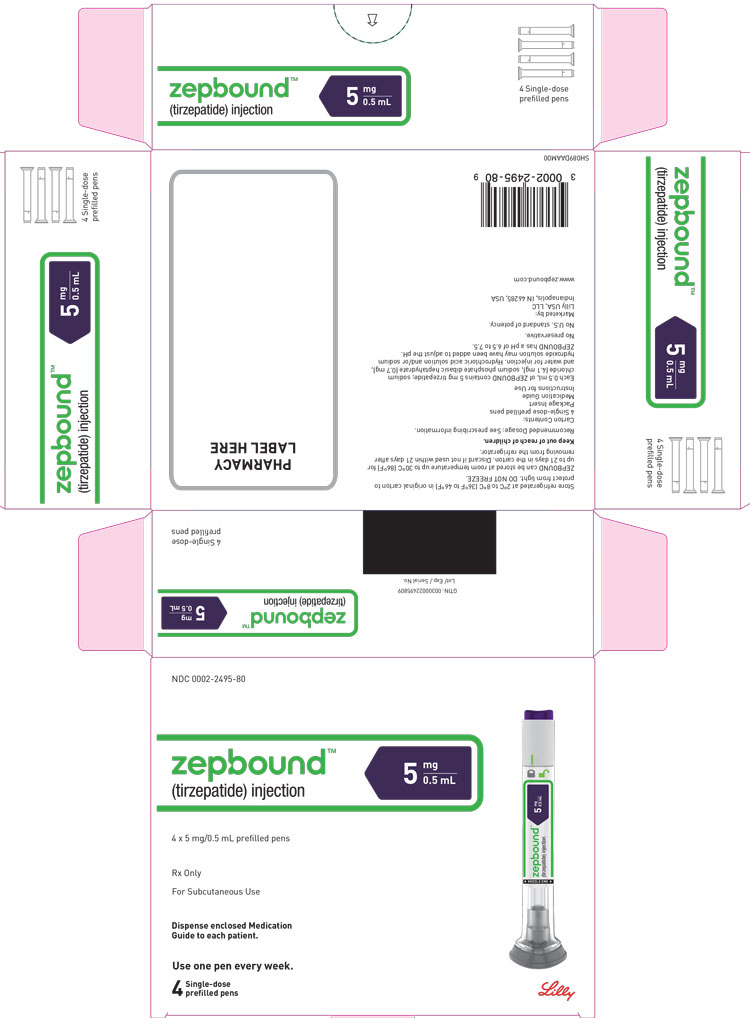
Package Label (Zepbound™, 5 mg/0.5 mL, Carton, 4 Single-Dose Pens)
Package Label (Zepbound™, 7.5 mg/0.5 mL, Carton, 4 Single-Dose Pens)
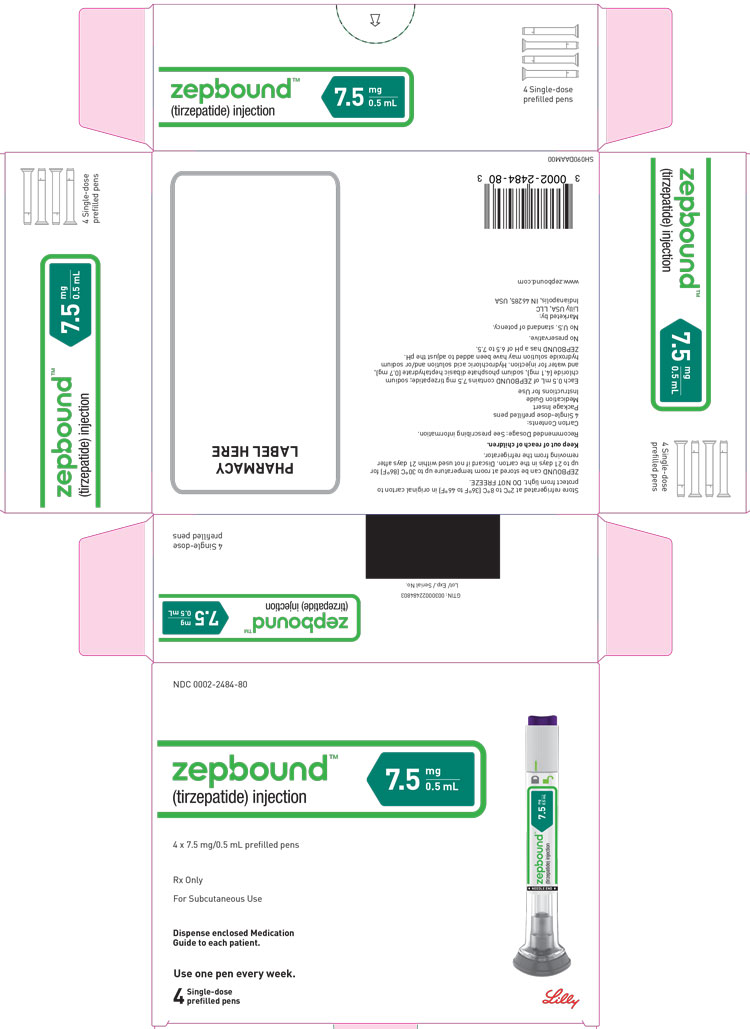
Figure (Zep Pen Ifu 1 V2)
Figure (Zep Pen Ifu 10 V1)
Figure (Zep Pen Ifu 2 V1)
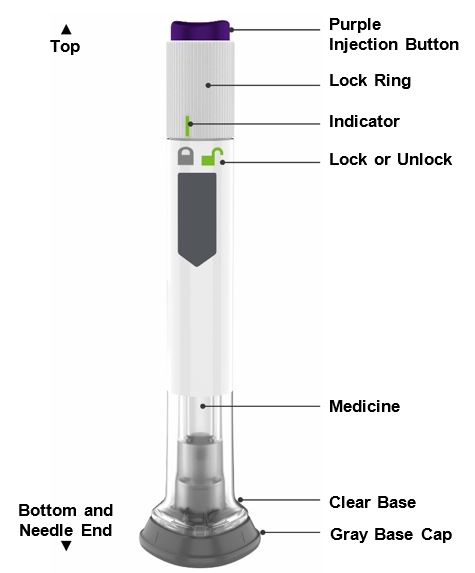
Figure (Zep Pen Ifu 3 V1)
Figure (Zep Pen Ifu 4a V1)
Figure (Zep Pen Ifu 4b V1)
Figure (Zep Pen Ifu 5 V1)
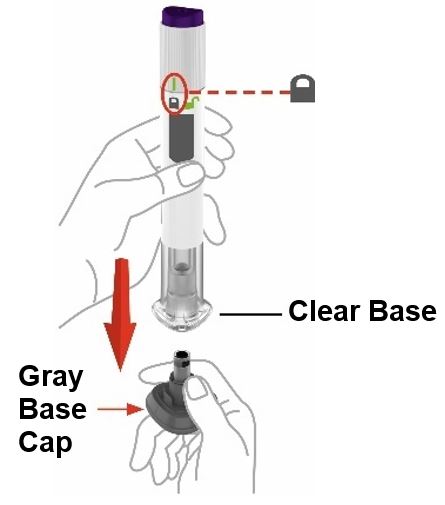
Figure (Zep Pen Ifu 6 V1)
Figure (Zep Pen Ifu 7 V1)
Figure (Zep Pen Ifu 8 V1)
Figure (Zep Pen Ifu 9 V1)
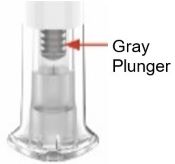
Figure (Zep Qr)

Structural Formula (Zep Uspi Chem V1)
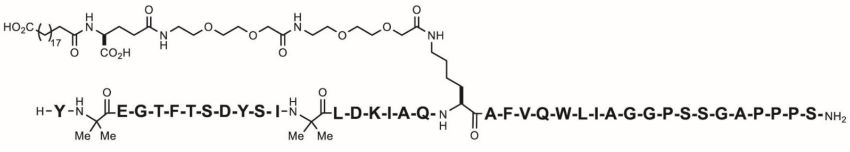
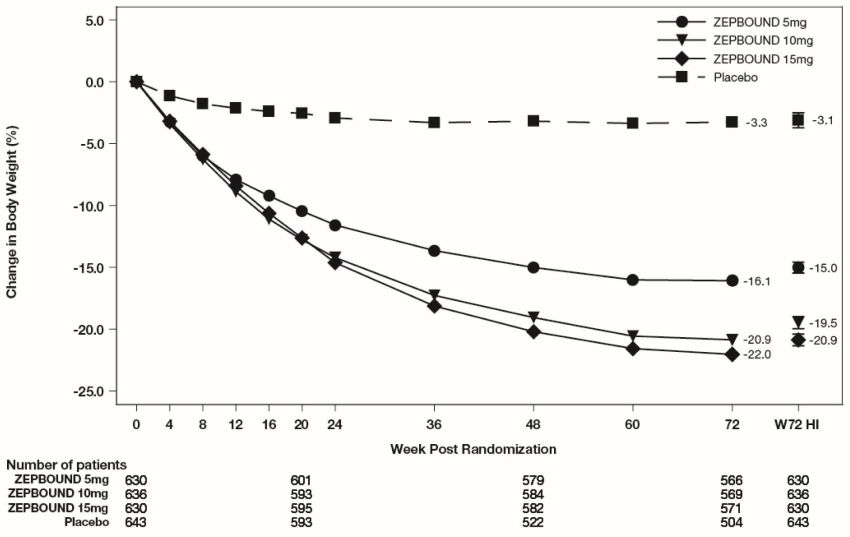
Figure 1 (Zep Uspi Fig1 V1)
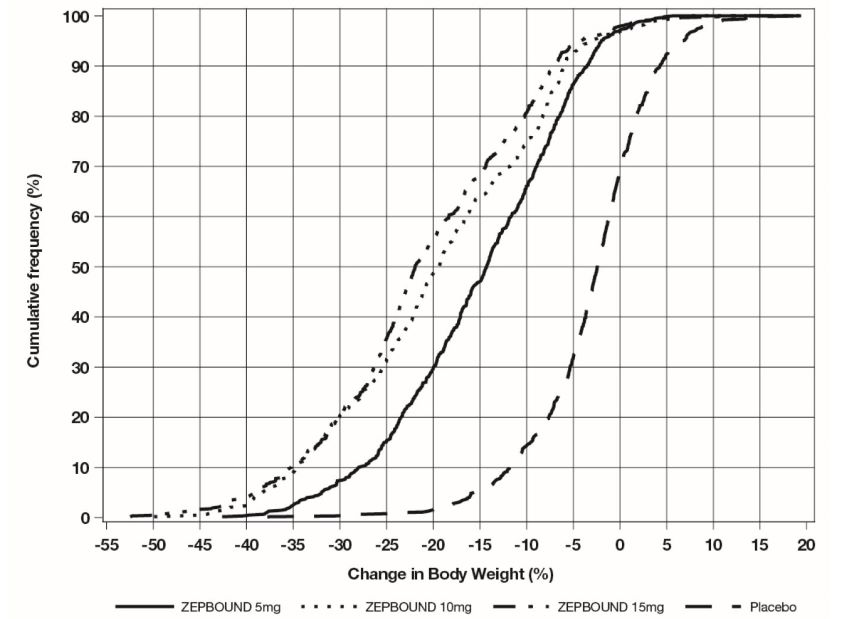
This text provides information about the cumulative frequency (%) and change in body weight (%) for different doses of ZEPBOUND and a placebo. The cumulative frequency graph shows the percentages along the x-axis ranging from -30 to 20 and the y-axis ranging from 0 to 100. The change in body weight is indicated for ZEPBOUND 5mg, ZEPBOUND 10mg, ZEPBOUND 15mg, and the placebo.*
Figure 2 (Zep Uspi Fig2 V1)
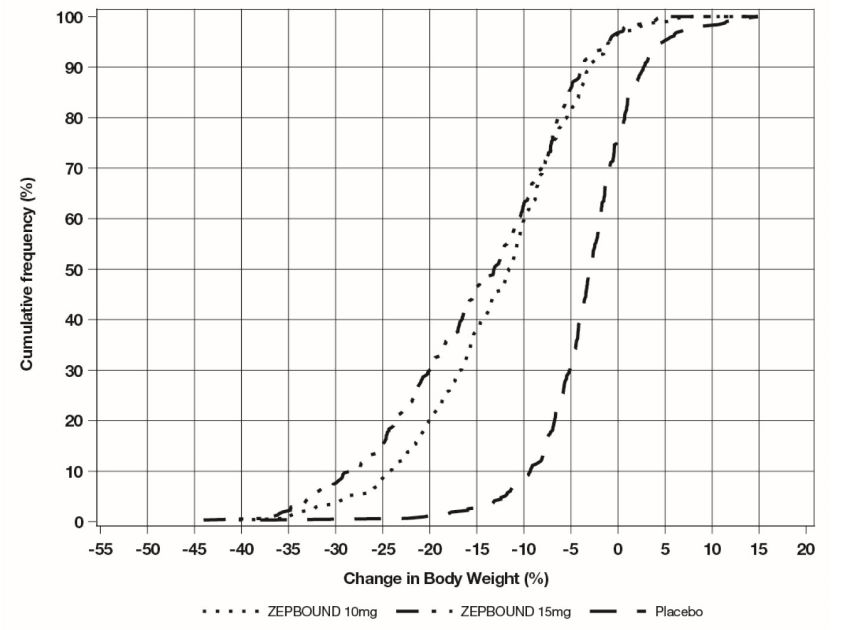
Figure 3 (Zep Uspi Fig3 V1)
Not available.*
Figure 4 (Zep Uspi Fig4 V1)
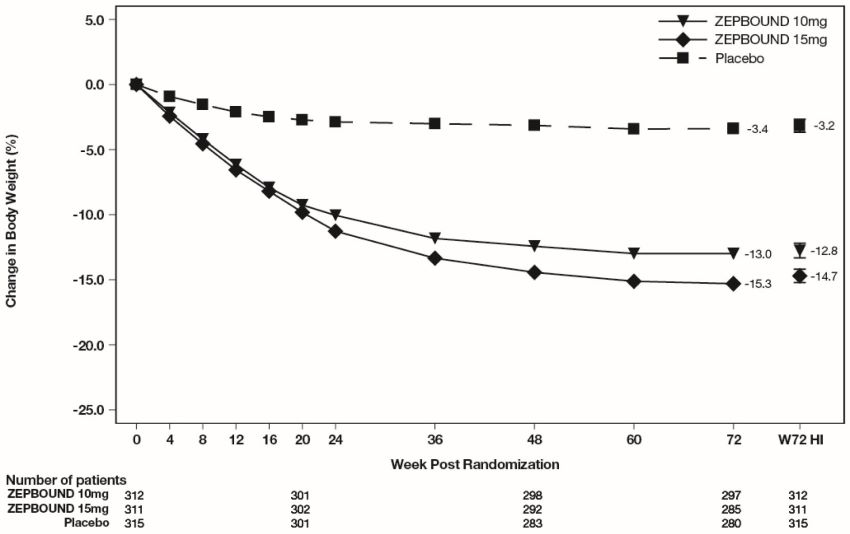
Table 1 (Zep Uspi T1 V1)
* These product label images have been analyzed using experimental machine learning. Please verify findings with the primary label text.