Product Images Emgality

View Photos of Packaging, Labels & Appearance

Product Label Images

The following 39 images provide visual information about the product associated with Emgality NDC 0002-2377 by Eli Lilly And Company, such as packaging, labeling, and the appearance of the drug itself. This resource could be helpful for medical professionals, pharmacists, and patients seeking to verify medication information and ensure they have the correct product.

PACKAGE CARTON – EMGALITY Prefilled Syringe 100 mg - emgality carton 100mg pfs 045 01

PACKAGE CARTON – EMGALITY Prefilled Syringe 100 mg - emgality carton 100mg pfs 045 01

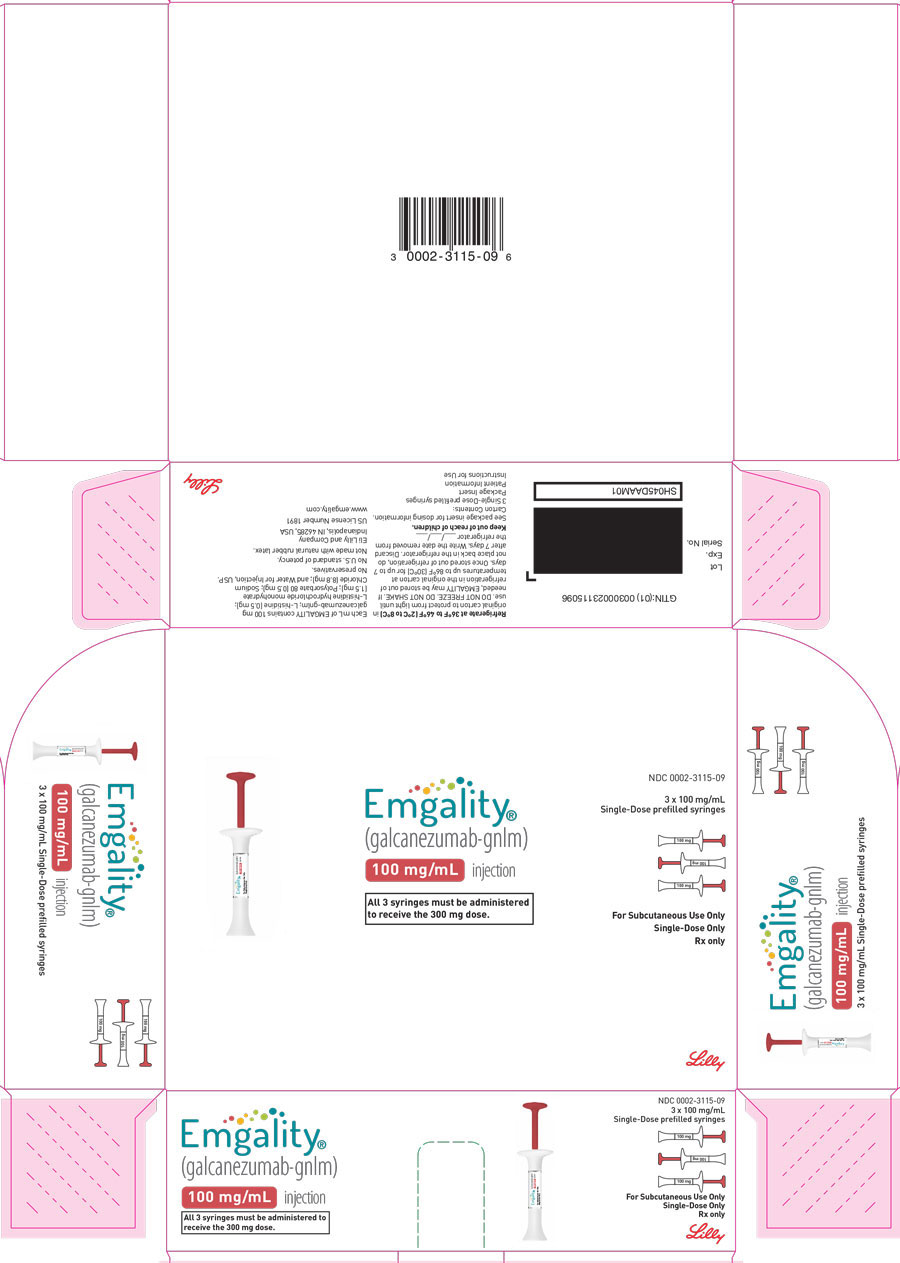
Emgality is a CCRETYETS injection that must be administered via syringes to receive the 300mg dose. It is indicated for subcutaneous use and is available in single-dose pre-filled syringes. The provided text also contains several distorted characters and various irrelevant information.*

PACKAGE CARTON – EMGALITY Autoinjector 120 mg - emgality carton 120mg ai 039 02

PACKAGE CARTON – EMGALITY Autoinjector 120 mg - emgality carton 120mg ai 039 02

PACKAGE CARTON – EMGALITY Prefilled Syringe 120 mg - emgality carton 120mg pfs 043 02

PACKAGE CARTON – EMGALITY Prefilled Syringe 120 mg - emgality carton 120mg pfs 043 02

Figure - emgality ifu 100mg pfs 1 v1

Figure - emgality ifu 100mg pfs 1 v1

Figure - emgality ifu 100mg pfs 2 v1

Figure - emgality ifu 100mg pfs 2 v1

This text may represent parts of a medical syringe device, which could include a thumb pad, coral plunger rod, finger grips, a gray syringe plunger, a syringe body to contain medicine, and a needle cap.*

Figure - emgality ifu 100mg pfs 3 v1

Figure - emgality ifu 100mg pfs 3 v1

Figure - emgality ifu 100mg pfs 4 v1

Figure - emgality ifu 100mg pfs 4 v1

Figure - emgality ifu 100mg pfs 5 v1

Figure - emgality ifu 100mg pfs 5 v1

Figure - emgality ifu 100mg pfs 6 v1

Figure - emgality ifu 100mg pfs 6 v1

Figure - emgality ifu 100mg pfs 7 v1

Figure - emgality ifu 100mg pfs 7 v1

The text seems to be a list of two objects, a coral plunger rod and a gray syringe plunger. It does not provide any further information or context.*

Figure - emgality ifu 100mg pfs 8 v1

Figure - emgality ifu 100mg pfs 8 v1

Figure - emgality ifu 120mg pfs 1 v1

Figure - emgality ifu 120mg pfs 1 v1

Figure - emgality ifu 120mg pfs 2 v1

Figure - emgality ifu 120mg pfs 2 v1

This appears to be a list of various parts of a medical syringe, including a thumb pad, a teal plunger, a rod, finger grips, a gray syringe body, a syringe plunger, and a needle. The text may be useful for someone looking to identify or replace specific parts of a syringe.*

Figure - emgality ifu 120mg pfs 3 v1

Figure - emgality ifu 120mg pfs 3 v1

Figure - emgality ifu 120mg pfs 4 v1

Figure - emgality ifu 120mg pfs 4 v1

Figure - emgality ifu 120mg pfs 5 v1

Figure - emgality ifu 120mg pfs 5 v1

Figure - emgality ifu 120mg pfs 6 v1

Figure - emgality ifu 120mg pfs 6 v1

Figure - emgality ifu 120mg pfs 7 v1

Figure - emgality ifu 120mg pfs 7 v1

This is a product description of a teal plunger rod and a gray syringe plunger.*

Figure - emgality ifu 120mg pfs 8 v1

Figure - emgality ifu 120mg pfs 8 v1

Figure - emgality ifu ai 1 v1

Figure - emgality ifu ai 1 v1

Figure - emgality ifu ai 2 v1

Figure - emgality ifu ai 2 v1

Figure - emgality ifu ai 3 v2

Figure - emgality ifu ai 3 v2

Figure - emgality ifu ai 4 v1

Figure - emgality ifu ai 4 v1

Figure - emgality ifu ai 5 v1

Figure - emgality ifu ai 5 v1

Figure - emgality ifu ai 6 v1

Figure - emgality ifu ai 6 v1

Figure - emgality ifu ai 7 v1

Figure - emgality ifu ai 7 v1

This text is a simple instruction on how to know when a medical injection is complete. It indicates that the gray plunger becomes visible when the injection is done.*

Figure - emgality ifu ai 8 v1

Figure - emgality ifu ai 8 v1

Figure - emgality ifu inj sites v2

Figure - emgality ifu inj sites v2

Figure - emgality ifu lock v1

Figure - emgality ifu lock v1

Figure - emgality ifu unlock v1

Figure - emgality ifu unlock v1

Figure 1 - emgality pi f1 v1

Figure 1 - emgality pi f1 v1

This is a chart that presents the mean change in Migraine Headache Days from Baseline up to Month 6 for EMGALITY 120 mg treatment.*

Figure 2 - emgality pi f2 v1

Figure 2 - emgality pi f2 v1

The text describes the mean change from baseline in migraine headache days over a period of six months, with measurements taken at monthly intervals. The data appears to be related to the use of a treatment called EMGALITY 120 mg, which may be effective in reducing the frequency of migraines.*

Figure 3 - emgality pi f3 v1

Figure 3 - emgality pi f3 v1

This is a chart that represents the percentage of patients with varying levels of decreased migraine days per month. The chart also includes information on the number of patients in each group and the medication (EMGALITY) being compared to the placebo. There are different intervals at which the decrease in migraine days is represented, ranging from more than 12 days to less than 2 days, and there is also a category for patients who experience no decrease or an increase in migraine days per month.*

Figure 4 - emgality pi f4 v1

Figure 4 - emgality pi f4 v1

This is a chart showing the percentage of patients who experienced fewer migraine days per month when treated with Emgality 120 mg compared to a placebo. The study involved 450 patients in the placebo group and 226 receiving Emgality. The chart also shows that Emgality was more effective than the placebo at all time intervals measured, and the highest difference was observed at week 12. The text also includes some numerical values related to the reduction in migraine days, but they are not clearly labeled.*

Figure 6 - emgality pi f5 v1

Figure 6 - emgality pi f5 v1

This is a graph that shows the mean change from baseline of migraine headache days over a period of three months. On the x-axis, it shows the baseline and the first, second, and third month, while on the y-axis it shows a number, which indicates the mean change from baseline. The treatment being evaluated is EMGALITY 120 mg, and it shows a mean change of 6.0 migraine headache days.*

Figure 6 - emgality pi f6 v1

Figure 6 - emgality pi f6 v1

This appears to be a chart displaying data on the number of patients and their respective migraine days for a placebo group and a group taking a drug called EMGALITY 120mg. It seems that there are different time frames for the data, such as months or weeks, but it is not clear because some characters are not readable.*

Figure 7 - emgality pi f7 v2

Figure 7 - emgality pi f7 v2

This data appears to be a chart or table displaying a comparison of mean change from baseline for a variable labeled as "Improvement". The values in the table seem to show the LS Mean Change from BL (SE), which could refer to the estimated least-squares mean change from baseline along with the standard error. The column headers display different time intervals indicated as "Baseline", "Week 1", "Week 2", and "Week 3". The text does not provide specific information about what is being evaluated, but it looks like the data could be related to the efficacy of a drug called "EMGALITY 300 mg".*

Figure 8 - emgality pi f8 v2

Figure 8 - emgality pi f8 v2

The text provides information on the percentage of patients who received Placebo or EMGALITY 300 mg for treating cluster headache attacks per week. It also shows the percentage reduction in cluster headache attacks per week. Therefore, it is a useful description of the effectiveness of the two treatments.*

Figure - emgality qr v1

Figure - emgality qr v1

* The product label images have been analyzed using a combination of traditional computing and machine learning techniques. It should be noted that the descriptions provided may not be entirely accurate as they are experimental in nature. Use the information in this page at your own discretion and risk.