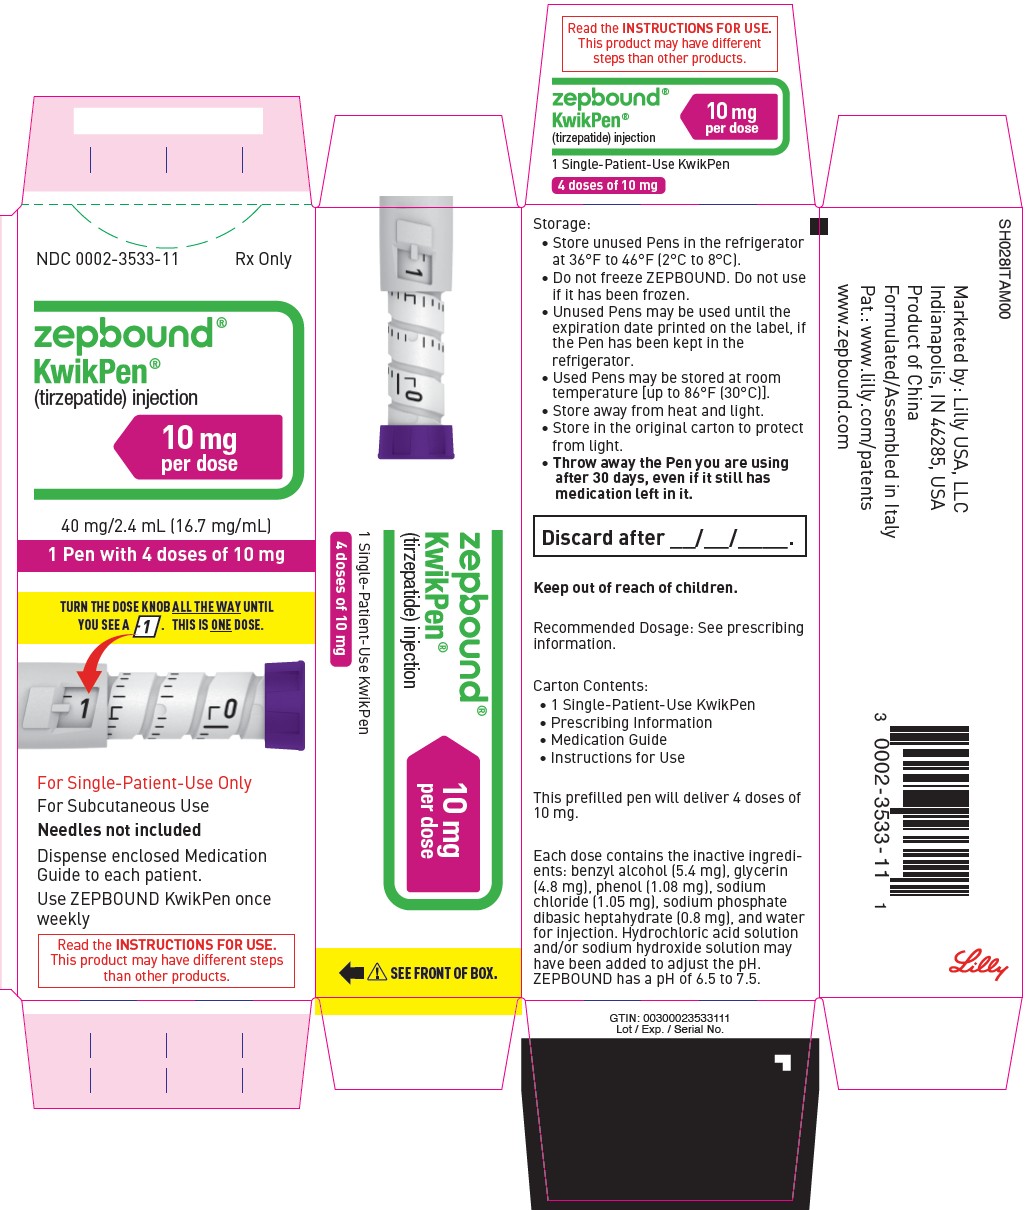
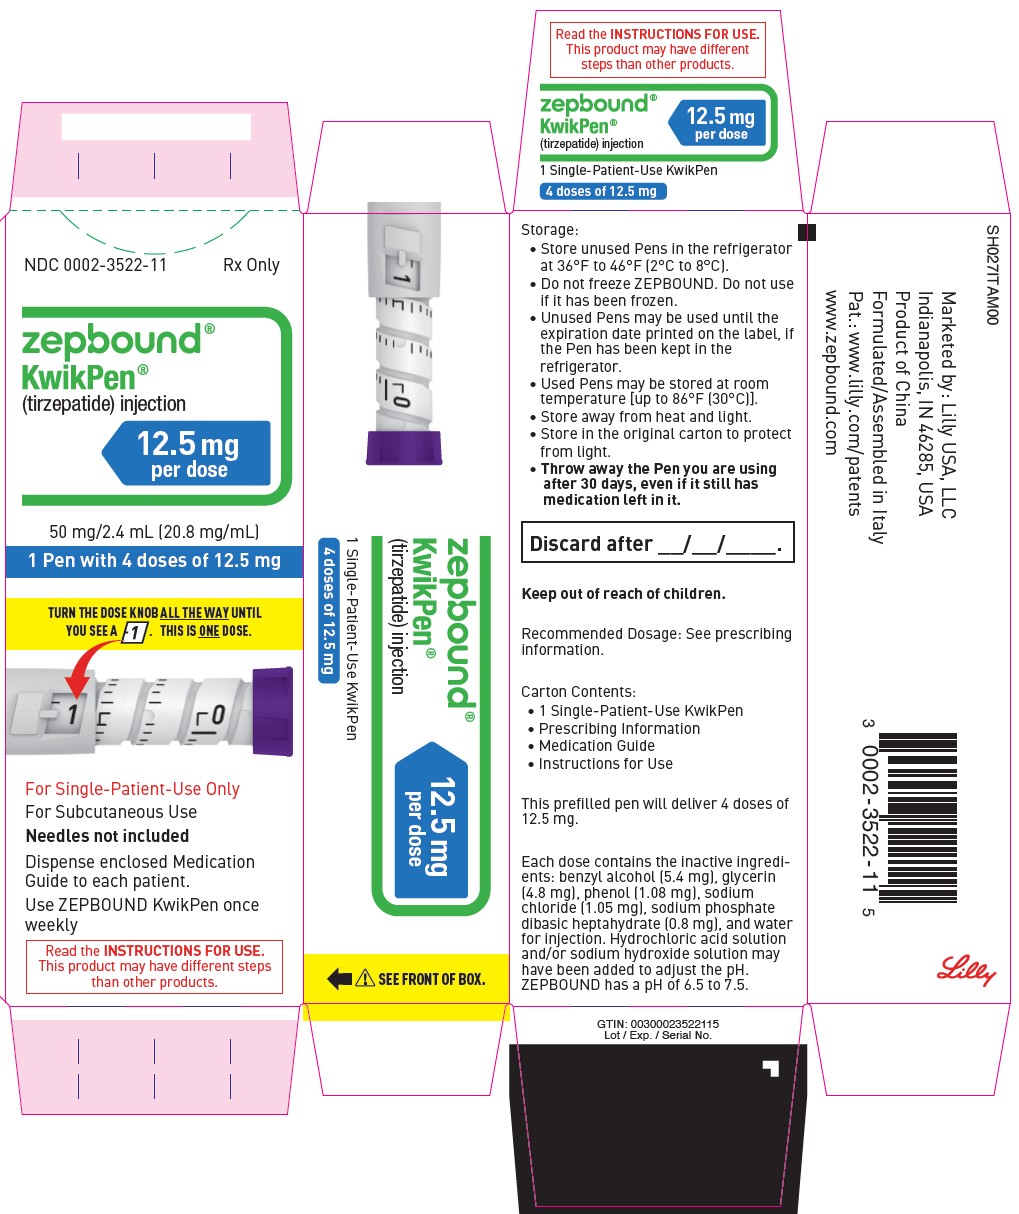
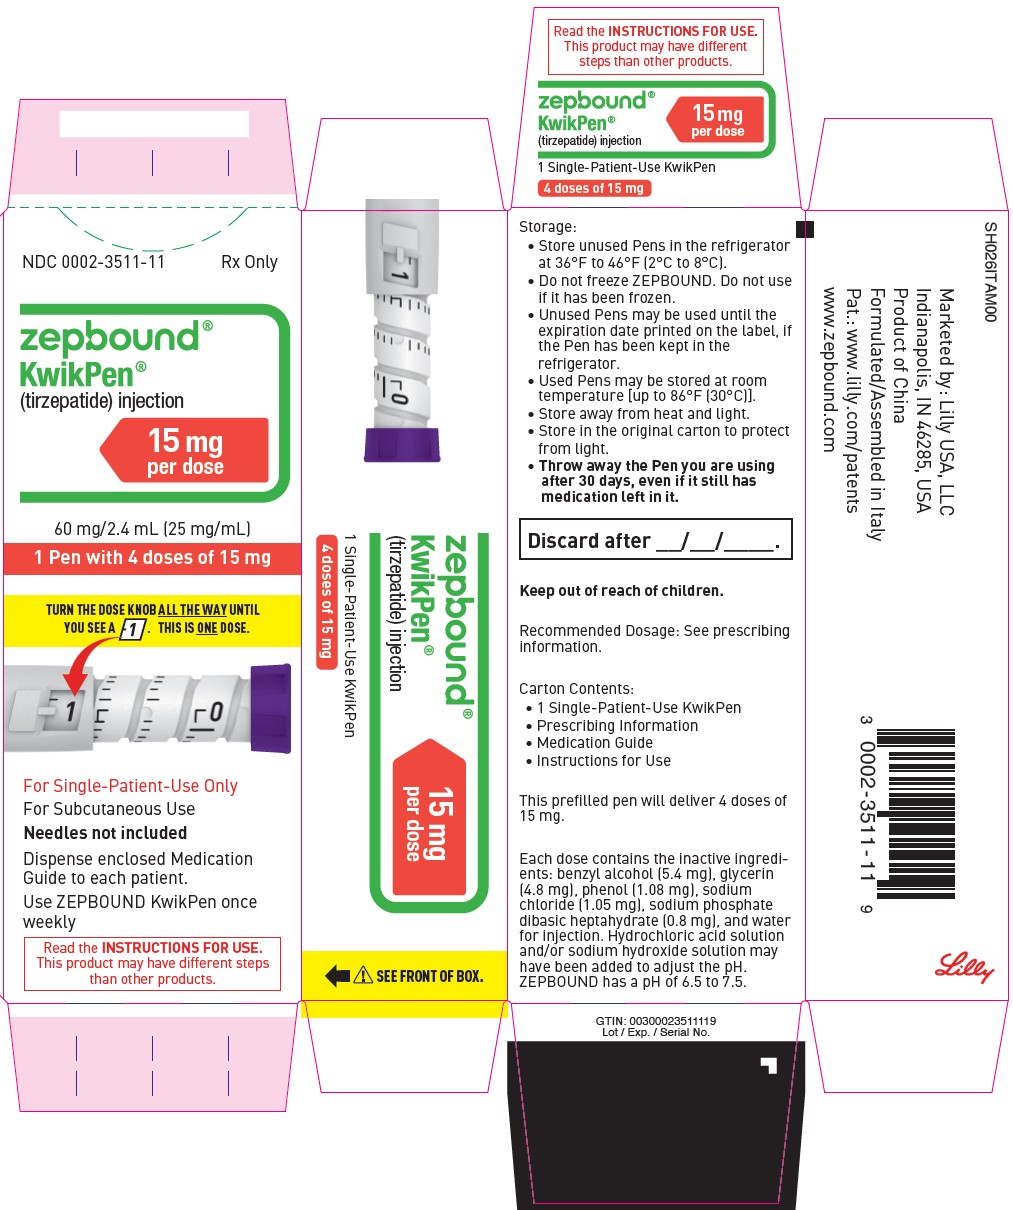
Limitations of Use
ZEPBOUND contains tirzepatide. Coadministration with other tirzepatide-containing products or with any glucagon-like peptide-1 (GLP-1) receptor agonist is not recommended.
Recommended Maintenance Dosage
Weight Reduction and Long-Term Maintenance
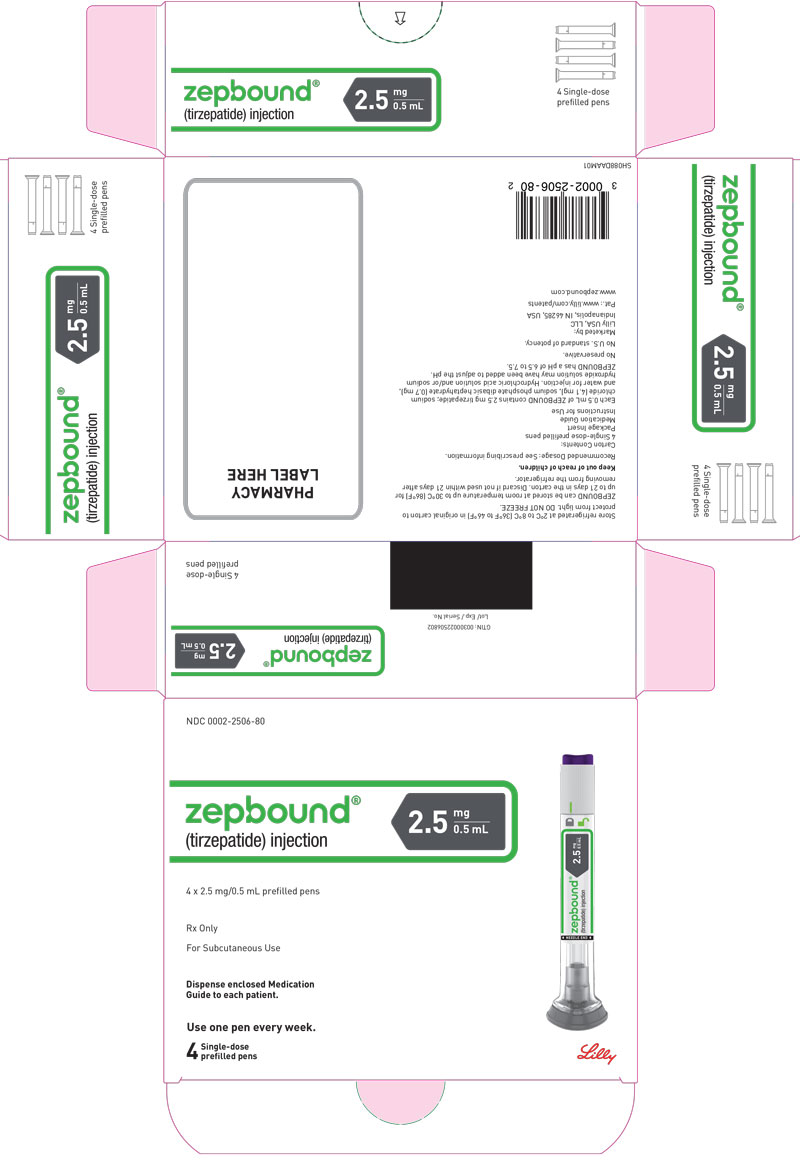
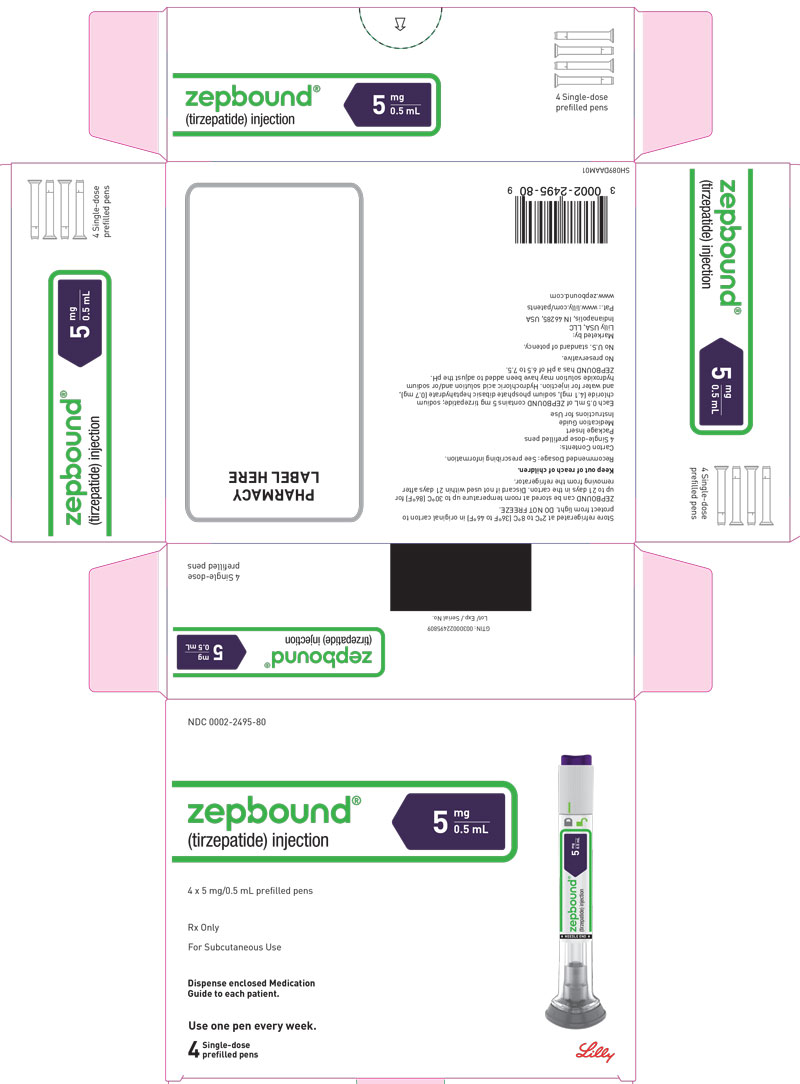
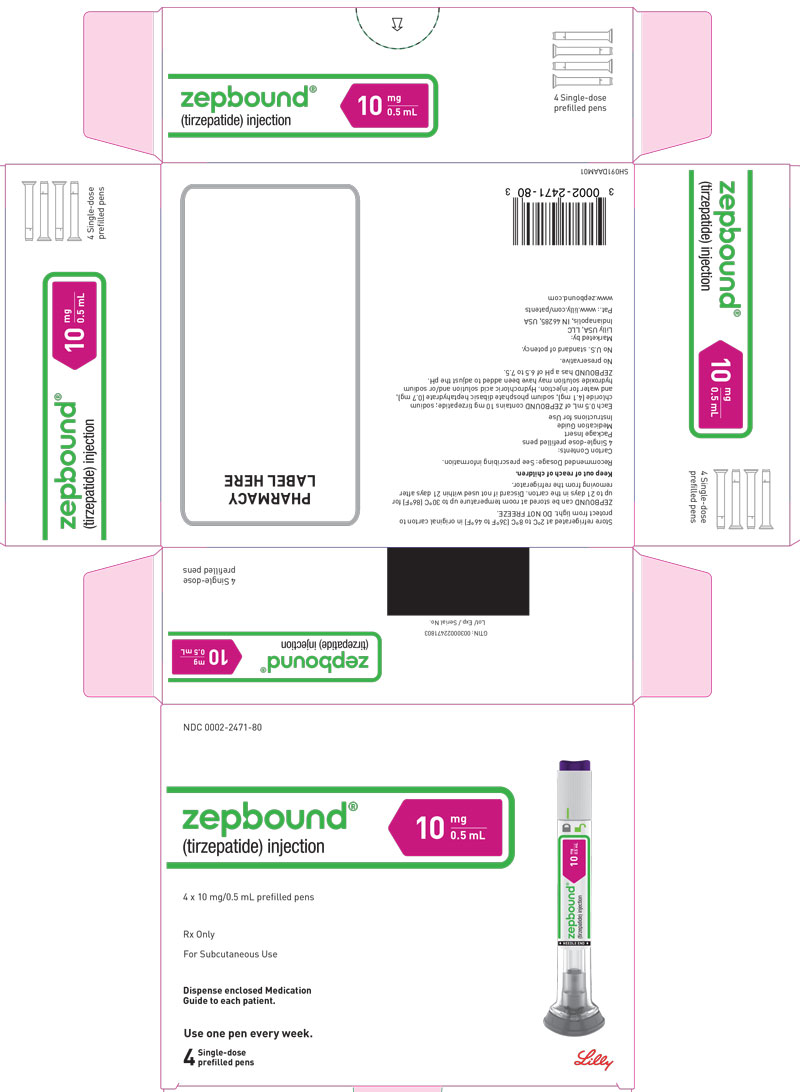
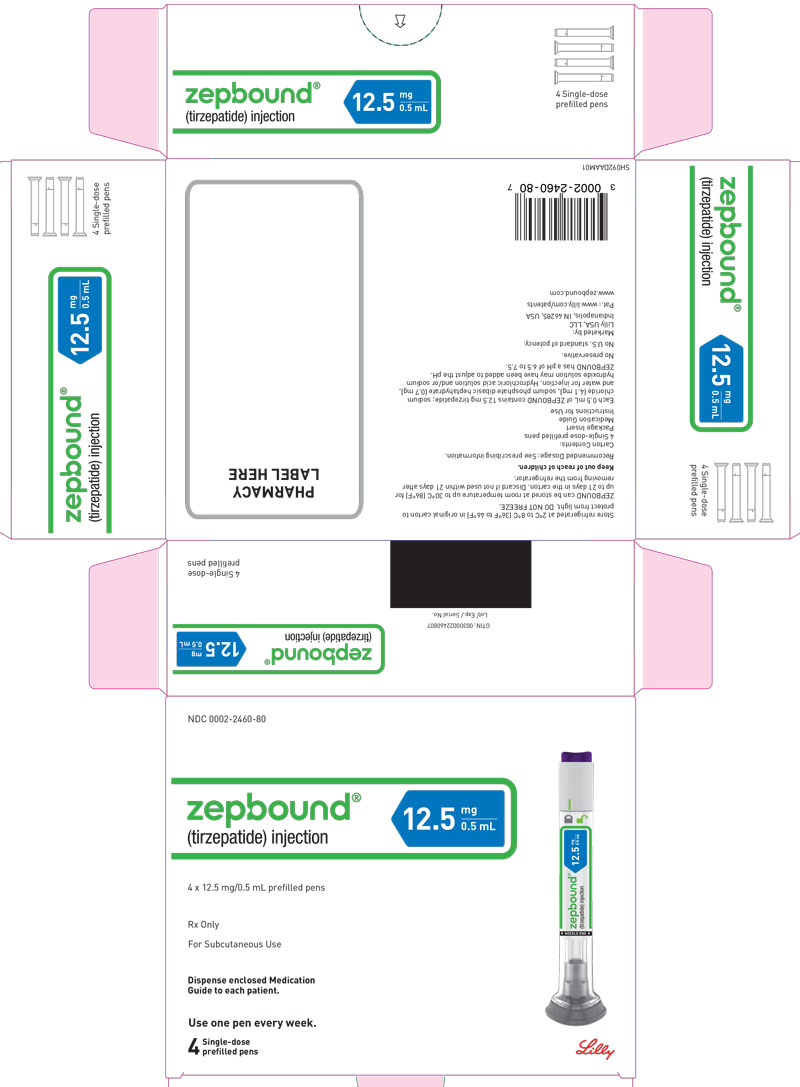
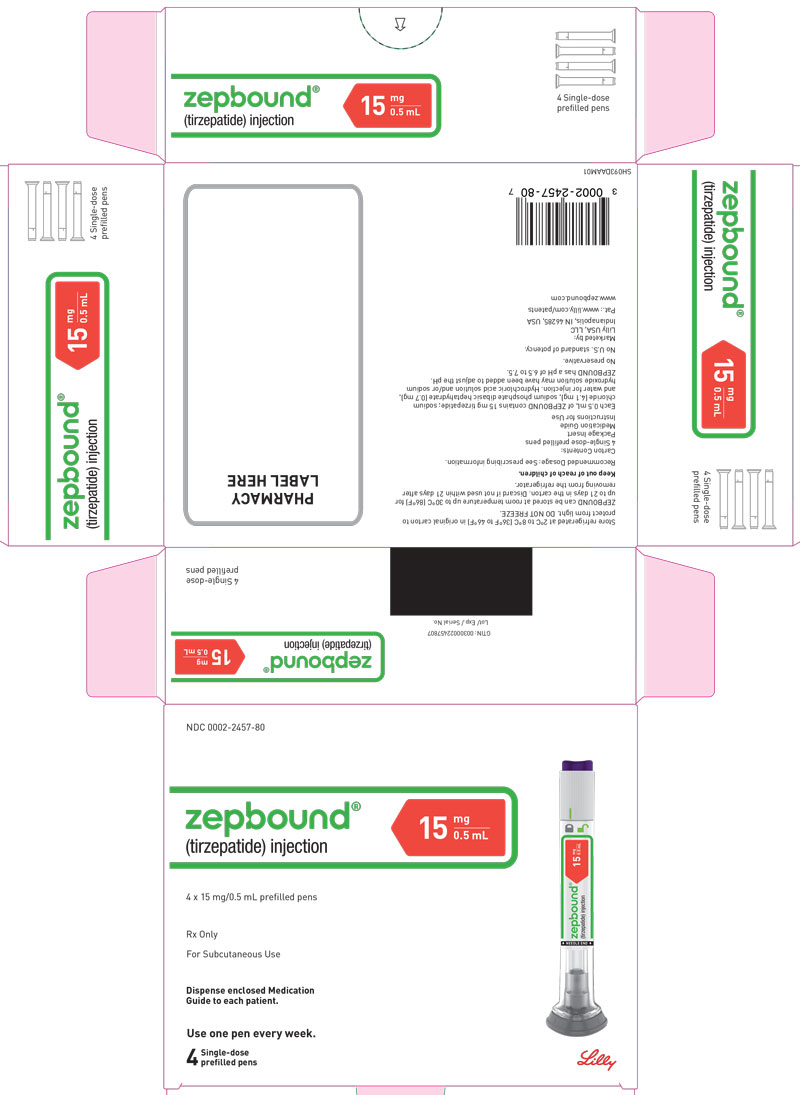
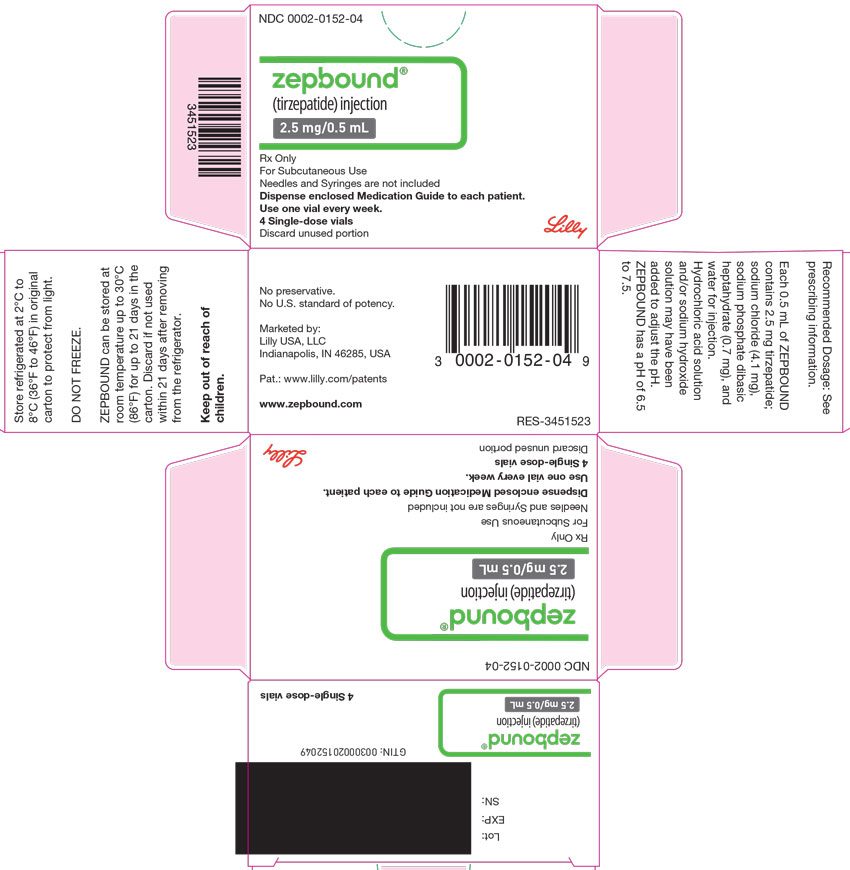
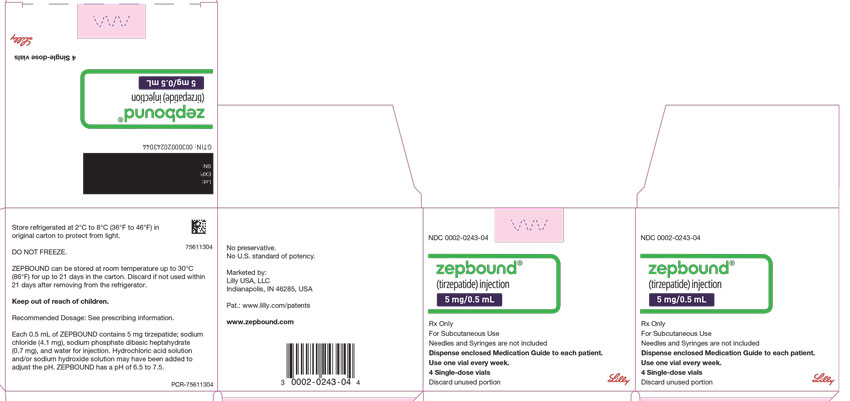
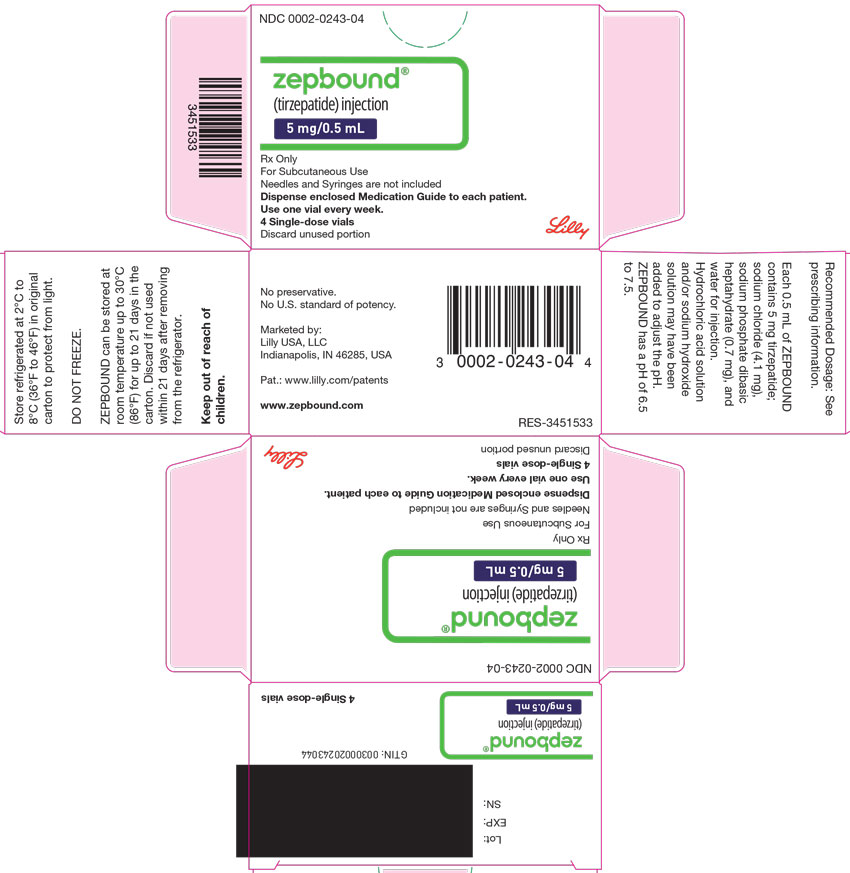
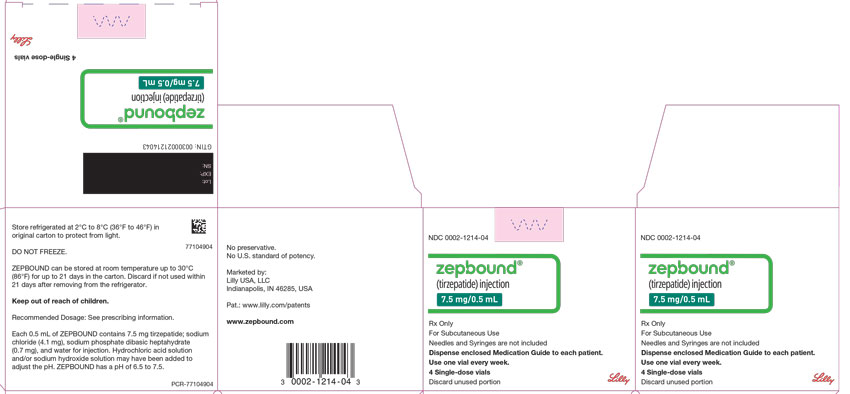
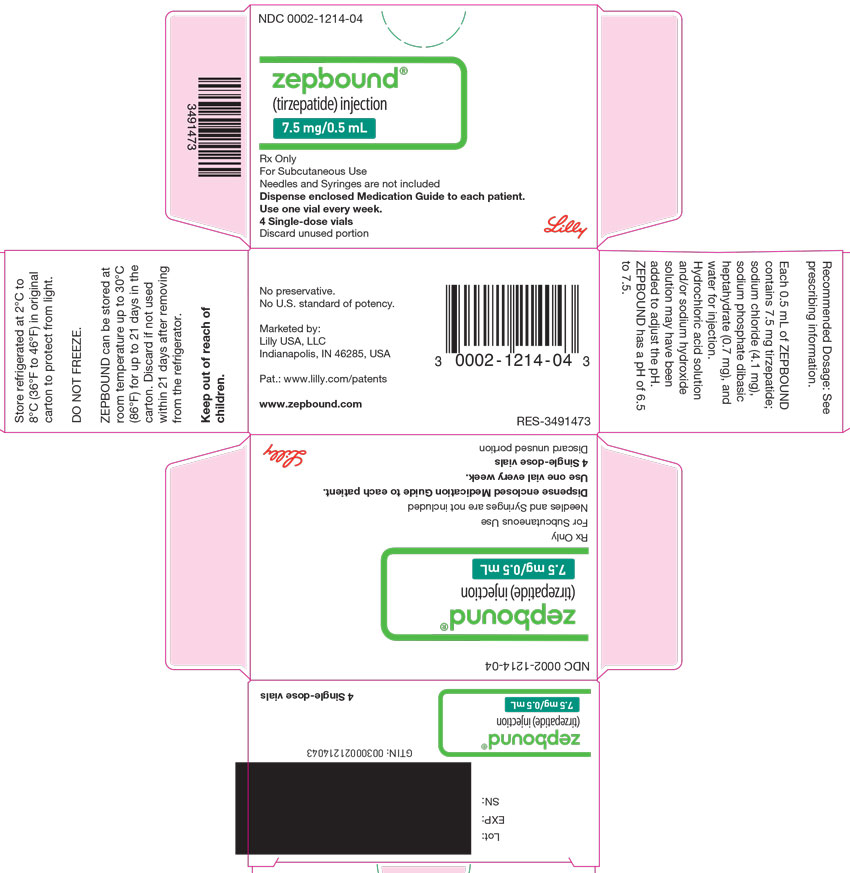
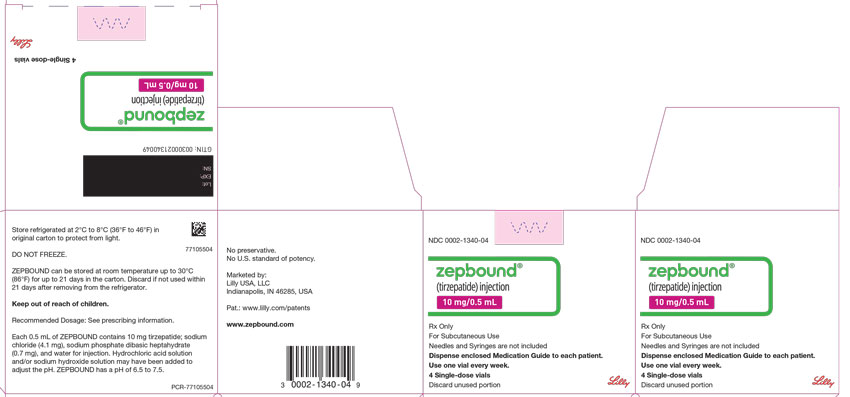
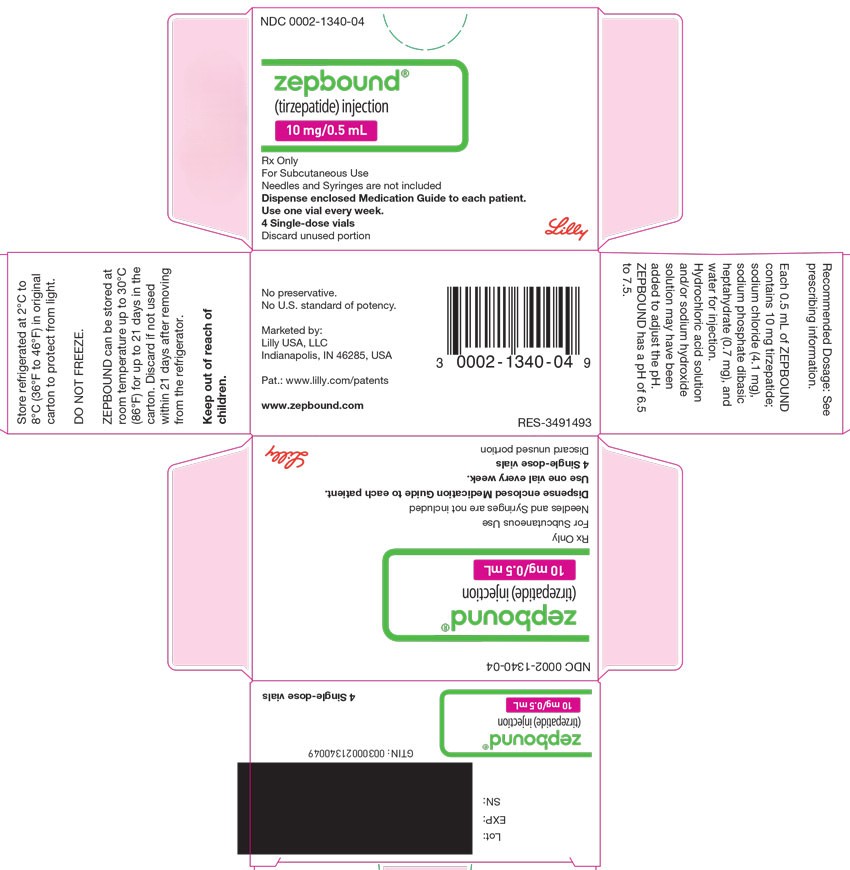
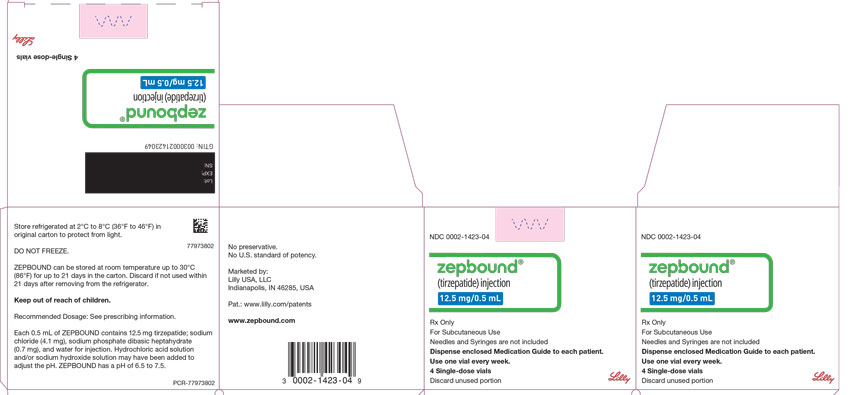
The recommended maintenance dosage is 5 mg, 10 mg, or 15 mg, injected subcutaneously once weekly.
OSA
The recommended maintenance dosage is 10 mg or 15 mg injected subcutaneously once weekly.
Maximum Recommended Dosage
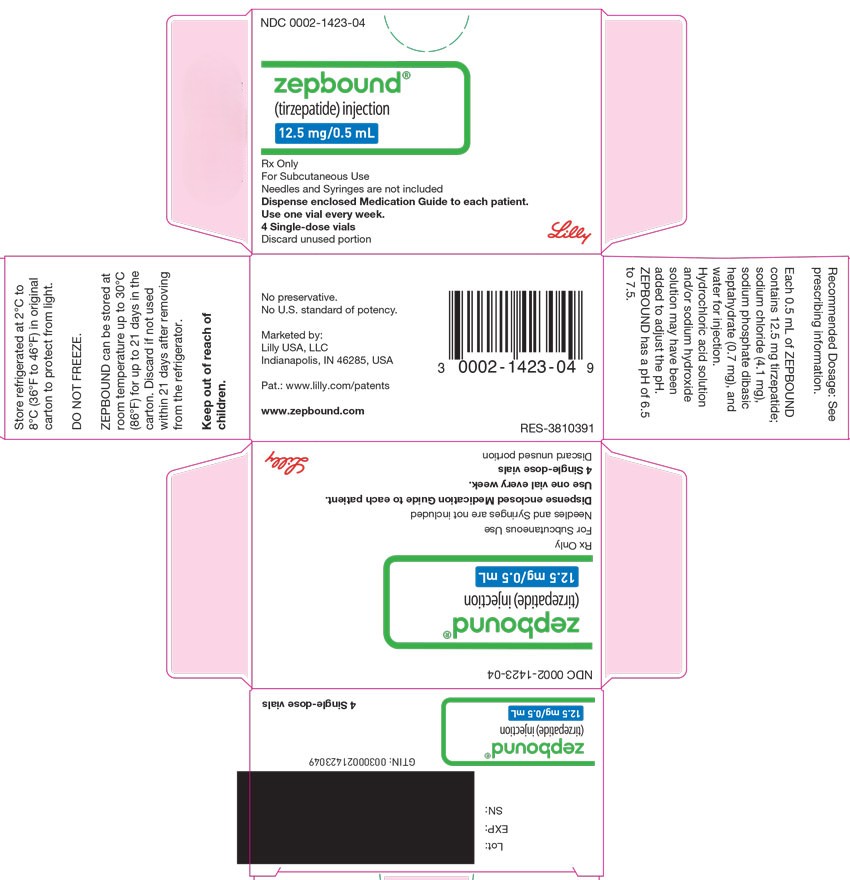
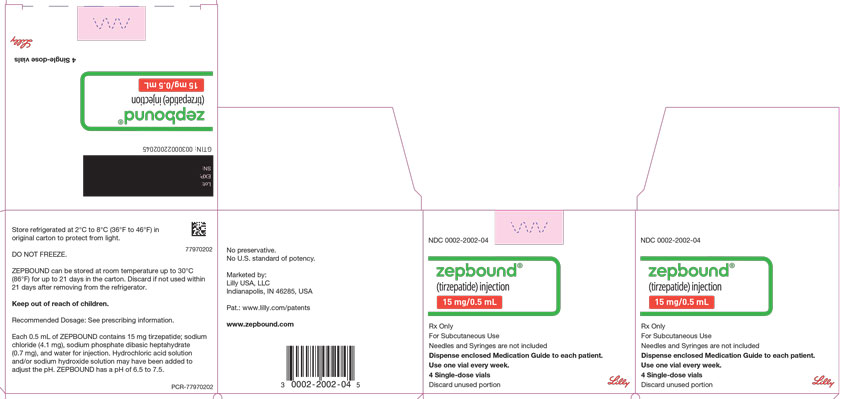
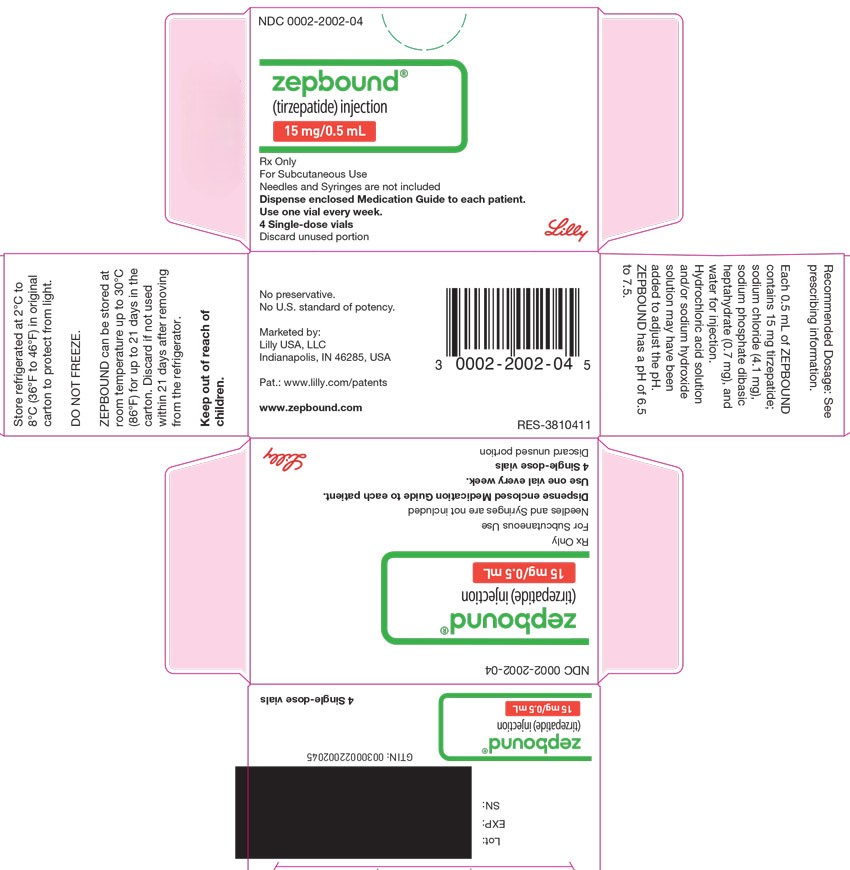
The maximum dosage of ZEPBOUND for all indications is 15 mg injected subcutaneously once weekly.
Adverse Reactions in Patients for Weight Reduction and Long-Term Maintenance
Pool of Placebo-Controlled Weight Reduction Trials in Adults with Obesity or Overweight, with or without Type 2 Diabetes (Study 1 and Study 2)
ZEPBOUND was evaluated for safety in a pool of two randomized, double-blind, placebo-controlled trials that included 2,519 adult patients with obesity or overweight treated with ZEPBOUND for up to 72 weeks and a 4-week off drug follow-up period (Study 1 and Study 2) [see Clinical Studies (14.1)]. The mean age of patients was 47 years and 37% were male. The population was 72% White, 12% Asian, 8% Black or African American, and 7% American Indian or Alaska Native; 51% identified as Hispanic or Latino ethnicity. Baseline characteristics included an average BMI of 37.4 kg/m2, 29% with a BMI ≥40 kg/m2, 41% with hypertension, 37% with dyslipidemia, 25% with type 2 diabetes mellitus, 7% with obstructive sleep apnea, and 4% with cardiovascular (CV) disease.
Across both trials, 4.8%, 6.3%, and 6.7% of patients treated with 5 mg, 10 mg, and 15 mg of ZEPBOUND, respectively, permanently discontinued treatment as a result of adverse reactions compared to 3.4% of patients treated with placebo. The majority of patients who discontinued ZEPBOUND due to adverse reactions did so during the first few months of treatment due to gastrointestinal adverse reactions.
Common Adverse Reactions
Table 1 shows common adverse reactions associated with the use of ZEPBOUND in the pool of two placebo-controlled trials for weight reduction (Study 1 and Study 2). These adverse reactions occurred more commonly with ZEPBOUND than with placebo and occurred in at least 2% of patients treated with ZEPBOUND.
Table 1: Adverse Reactions (≥2% and Greater than Placebo) in ZEPBOUND-Treated Adults with Obesity or Overweight in Weight Reduction and Long-term Maintenance Trials (Study 1 and Study 2)
|
|
|
|
|
|
Adverse Reaction |
Placebo
(N=958)
% | ZEPBOUND
5 mg
(N=630)
% | ZEPBOUND
10 mg
(N=948)
% | ZEPBOUND
15 mg
(N=941)
% |
| Nausea
| 8
| 25
| 29
| 28
|
| Diarrheaa | 8
| 19
| 21
| 23
|
| Vomiting
| 2
| 8
| 11
| 13
|
| Constipationb | 5
| 17
| 14
| 11
|
| Abdominal Painc | 5
| 9
| 9
| 10
|
| Dyspepsia
| 4
| 9
| 9
| 10
|
| Injection Site Reactionsd | 2
| 6
| 8
| 8
|
| Fatiguee | 3
| 5
| 6
| 7
|
| Hypersensitivity Reactions
| 3
| 5
| 5
| 5
|
| Eructation
| 1
| 4
| 5
| 5
|
| Hair Loss
| 1
| 5
| 4
| 5
|
| Gastroesophageal Reflux Disease
| 2
| 4
| 4
| 5
|
| Flatulence
| 2
| 3
| 3
| 4
|
| Abdominal Distension
| 2
| 3
| 3
| 4
|
| Dizziness
| 2
| 4
| 5
| 4
|
| Hypotensionf | 0
| 1
| 1
| 2
|
In a clinical trial for weight reduction that included an intensive lifestyle intervention lead-in period (Study 3), 287 patients were treated with ZEPBOUND for up to 72 weeks. In a randomized withdrawal trial (Study 4), 783 patients were treated with ZEPBOUND for up to 36 weeks, and 335 of these patients were treated for up to 88 weeks [see Clinical Studies (14.1)]. In Study 3, 10% of ZEPBOUND-treated patients and 2% of placebo-treated patients discontinued drug due to adverse reactions. In Study 4, 7% of patients discontinued ZEPBOUND treatment before randomized withdrawal at Week 36 due to adverse reactions. In Study 3 and Study 4, adverse reactions were similar to those reported in the two pooled ZEPBOUND clinical trials (Study 1 and Study 2).
Gastrointestinal Adverse Reactions
In a pool of Study 1 and 2, gastrointestinal adverse reactions occurred more frequently among patients receiving ZEPBOUND (5 mg 56%, 10 mg 56%, 15 mg 56%) than placebo (30%). More patients receiving ZEPBOUND 5 mg (1.9%), ZEPBOUND 10 mg (3.3%), and ZEPBOUND 15 mg (4.3%) discontinued treatment due to gastrointestinal adverse reactions than patients receiving placebo (0.5%). The majority of nausea, vomiting, and/or diarrhea events occurred during dose escalation and decreased over time.
Acute Pancreatitis
In clinical trials of tirzepatide for a different indication, 14 events of acute pancreatitis were confirmed by adjudication in 13 tirzepatide-treated patients (0.23 patients per 100 years of exposure) versus 3 events in 3 comparator-treated patients (0.11 patients per 100 years of exposure). In a pool of two ZEPBOUND clinical trials for weight reduction (Studies 1 and 2), 0.2% of ZEPBOUND-treated patients had acute pancreatitis confirmed by adjudication (0.14 patients per 100 years of exposure) versus 0.2% of placebo-treated patients (0.15 patients per 100 years of exposure). The exposure-adjusted incidence rate for treatment-emergent adjudication-confirmed pancreatitis in the pooled clinical studies for OSA (Studies 5 and 6) was 0.84 patients per 100 years for ZEPBOUND and 0 for placebo-treated patients.
Hypotension
In a pool of Study 1 and 2, hypotension occurred more frequently among patients taking ZEPBOUND (1.6%) than patients taking placebo (0.1%). Hypotension was more frequently seen in ZEPBOUND-treated patients on concomitant antihypertensive therapy (2.2%) compared to ZEPBOUND-treated patients not on antihypertensive therapy (1.2%). Hypotension also occurred in association with gastrointestinal adverse events and dehydration.
Hypersensitivity Reactions
In a pool of Study 1 and 2, immediate hypersensitivity reactions (within one day after drug administration) occurred in 2.1% of ZEPBOUND-treated patients compared to 0.4% of placebo-treated patients, while non-immediate hypersensitivity reactions occurred in 3.5% of ZEPBOUND-treated patients compared to 2.7% of placebo-treated patients. Among ZEPBOUND-treated patients, hypersensitivity reactions were more frequent in those with anti-tirzepatide antibodies (6.2%) compared to those who did not develop anti-tirzepatide antibodies (3%) [see Clinical Pharmacology (12.6)]. The majority of the hypersensitivity reactions in trials were skin reactions (e.g., rash, itching).
Injection Site Reactions
In ZEPBOUND-treated patients in a pool of Study 1 and 2, injection site reactions were more frequent in those with anti-tirzepatide antibodies (11.3%) compared to those who did not develop anti-tirzepatide antibodies (1%) [see Clinical Pharmacology (12.6)].
Hair Loss
Hair loss adverse reactions in ZEPBOUND-treated patients were associated with weight reduction. In a pool of Study 1 and 2, hair loss was reported more frequently in female than male patients in the ZEPBOUND (7.1% female versus 0.5% male) and placebo (1.3% female versus 0% male) treatment groups. No ZEPBOUND-treated patients and one placebo-treated patient discontinued study treatment due to hair loss.
Other Adverse Reactions
Acute Kidney Injury
In a pool of Study 1 and 2, acute kidney injury was reported in 0.5% of ZEPBOUND-treated patients compared to 0.2% of placebo-treated patients.
Acute Gallbladder Disease
In a pool of Study 1 and 2, cholelithiasis was reported in 1.1% of ZEPBOUND-treated patients and 1% of placebo-treated patients, cholecystitis was reported in 0.7% of ZEPBOUND-treated patients and 0.2% of placebo-treated patients, and cholecystectomy was reported in 0.2% of ZEPBOUND-treated patients and no placebo-treated patients.
Hypoglycemia
In Study 2, a trial of patients with type 2 diabetes mellitus and BMI ≥27 kg/m2, hypoglycemia (plasma glucose <54 mg/dL) was reported in 4.2% of ZEPBOUND-treated patients versus 1.3% of placebo-treated patients.
In Study 1, a trial of ZEPBOUND in adults with obesity/overweight without type 2 diabetes mellitus, there was no systematic capturing of hypoglycemia, but plasma glucose <54 mg/dL was reported in 0.3% of ZEPBOUND-treated patients versus no placebo-treated patients.
Heart Rate Increase
In a pool of Study 1 and 2, treatment with ZEPBOUND resulted in a mean increase in heart rate of 1 to 3 beats per minute compared to no increase in placebo-treated patients.
Dysesthesia
In a pool of Study 1 and 2, dysesthesia occurred more frequently among patients receiving ZEPBOUND (5 mg 0.2%, 10 mg 0.2%, 15 mg 0.4%) than placebo (0.1%).
Dysgeusia
In a pool of Study 1 and 2, dysgeusia was reported by 0.4% of ZEPBOUND-treated patients and no placebo-treated patients.
Dry Mouth
In a pool of Study 1 and 2, dry mouth or dry throat was reported by 1% of ZEPBOUND-treated patients and 0.1% of placebo-treated patients.
Laboratory Abnormalities
Amylase and Lipase Increase
In a pool of Study 1 and 2, treatment with ZEPBOUND resulted in mean increases from baseline in serum pancreatic amylase concentrations of 20% to 25% and serum lipase concentrations of 28% to 35%, compared to mean increases from baseline in pancreatic amylase of 2.1% and serum lipase of 5.8% in placebo-treated patients. The clinical significance of elevations in amylase or lipase with ZEPBOUND is unknown in the absence of other signs and symptoms of pancreatitis.
Adverse Reactions in Patients with Obstructive Sleep Apnea
ZEPBOUND was evaluated in 2 randomized, double-blind, placebo-controlled trials (Study 5 and Study 6) that included a total of 467 adult patients with moderate to severe OSA and obesity [see Clinical Studies (14.2)]. Study 5 enrolled 234 patients who were unable or unwilling to use Positive Airway Pressure (PAP) therapy and Study 6 enrolled 235 patients who were on PAP therapy. The adverse reactions observed with ZEPBOUND 10 mg or 15 mg administered subcutaneously once weekly were similar to those reported in the two pooled placebo controlled clinical trials for weight reduction (Study 1 and Study 2).
Pregnancy Exposure Registry
There is a pregnancy exposure registry that monitors pregnancy outcomes in women exposed to ZEPBOUND (tirzepatide) during pregnancy. Pregnant patients exposed to ZEPBOUND and healthcare providers are encouraged to register by calling 1-844-524-0039 or emailing at [email protected]. To learn more please call or visit https://pregnancyregistry.lilly.com/zepbound.
Risk Summary
Weight loss offers no benefit to a pregnant patient and may cause fetal harm. Advise pregnant patients that weight loss is not recommended during pregnancy and to discontinue ZEPBOUND when a pregnancy is recognized (see Clinical Considerations). Available data with tirzepatide in pregnant patients are insufficient to evaluate for a drug-related risk of major birth defects, miscarriage, or other adverse maternal or fetal outcomes. Based on animal reproduction studies, there may be risks to the fetus from exposure to tirzepatide during pregnancy.
In pregnant rats administered tirzepatide during organogenesis, fetal growth reductions and fetal abnormalities occurred at clinical exposure in maternal rats based on AUC. In rabbits administered tirzepatide during organogenesis, fetal growth reductions were observed at clinically relevant exposures based on AUC. These adverse embryo/fetal effects in animals coincided with pharmacological effects on maternal weight and food consumption (see Data).
The estimated background risk of major birth defects and miscarriage for the indicated population is increased when compared to the general population. In the U.S. general population, the estimated background risk of major birth defects and miscarriage in clinically recognized pregnancies is 2-4% and 15-20%, respectively.
Clinical Considerations
Disease-Associated Maternal and/or Embryo/Fetal Risk
Appropriate weight gain based on pre-pregnancy weight is currently recommended for all pregnant patients, including those with obesity or overweight, due to the obligatory weight gain that occurs in maternal tissues during pregnancy.
Data
Animal Data
In pregnant rats given twice weekly subcutaneous doses of 0.02, 0.1, and 0.5 mg/kg tirzepatide [0.03-, 0.07-, and 0.5-fold the maximum recommended human dose (MRHD) of 15 mg once weekly based on AUC] during organogenesis, increased incidences of external, visceral, and skeletal malformations, increased incidences of visceral and skeletal developmental variations, and decreased fetal weights coincided with pharmacologically-mediated reductions in maternal body weights and food consumption at 0.5 mg/kg. In pregnant rabbits given once weekly subcutaneous doses of 0.01, 0.03, or 0.1 mg/kg tirzepatide (0.01-, 0.06-, and 0.2-fold the MRHD) during organogenesis, pharmacologically mediated effects on the gastrointestinal system resulting in maternal mortality or abortion in a few rabbits occurred at all dose levels. Reduced fetal weights associated with decreased maternal food consumption and body weights were observed at 0.1 mg/kg. In a pre- and post-natal study in rats administered subcutaneous doses of 0.02, 0.10, or 0.25 mg/kg tirzepatide twice weekly from implantation through lactation, F1 pups from F0 maternal rats given 0.25 mg/kg tirzepatide had statistically significant lower mean body weight when compared to controls from post-natal day 7 through post-natal day 126 for males and post-natal day 56 for females.
Risk Summary
In a single-dose clinical lactation study, the concentration of tirzepatide in breast milk was found to be either undetectable or low compared to the maternal administered dose (see Data). There are no available data on the effects of tirzepatide on the breastfed infant or on milk production. The developmental and health benefits of breastfeeding should be considered along with the mother's clinical need for ZEPBOUND and any potential adverse effects on the breastfed infant from ZEPBOUND or from the underlying maternal condition.
Data
Following subcutaneous administration of a single 5 mg dose to 11 healthy lactating adult females, the concentration of tirzepatide in breast milk was found to be undetectable (limit of detection in breast milk 4 ng/mL) in 164/171 samples assayed. The cumulative amount of tirzepatide detected in the remaining 7 breast milk samples over the 28-day sampling window was equivalent to less than 0.02% of the maternal administered dose, with the last measurable concentrations occurring 5 days post-dose. The AUC of tirzepatide in breast milk could not be calculated, due to insufficient quantifiable concentrations.
Contraception
Use of ZEPBOUND may reduce the efficacy of oral hormonal contraceptives due to delayed gastric emptying. This delay is largest after the first dose and diminishes over time. Advise patients using oral hormonal contraceptives to switch to a non-oral contraceptive method, or add a barrier method of contraception for 4 weeks after initiation with ZEPBOUND and for 4 weeks after each dose escalation [see Drug Interactions (7.2) and Clinical Pharmacology (12.2, 12.3)].
Absorption
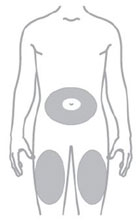
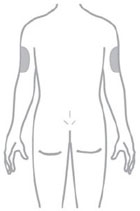
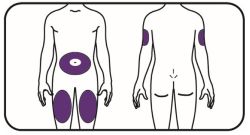
Following subcutaneous administration, the median time (range) to maximum plasma concentration of tirzepatide is 24 hours (8 to 72 hours). The mean absolute bioavailability of tirzepatide following subcutaneous administration is 80%. Similar exposure was achieved with subcutaneous administration of tirzepatide in the abdomen, thigh, or upper arm.
Distribution
The mean [coefficient of variation (CV)%] apparent steady-state volumes of distribution of tirzepatide following subcutaneous administration in patients with overweight or obesity and patients with OSA and obesity are approximately 9.7 L (29%) and 11.8 L (37%), respectively. Tirzepatide is highly bound to plasma albumin (99%).
Elimination
The apparent population mean clearance of tirzepatide in patients with overweight or obesity and patients with OSA and obesity is approximately 0.06 L/h (CV% ~ 20%). The elimination half-life is approximately 5-6 days in patients with overweight or obesity, and in patients with OSA and obesity.
Metabolism
Tirzepatide is metabolized by proteolytic cleavage of the peptide backbone, beta-oxidation of the C20 fatty diacid, and amide hydrolysis.
Excretion
The primary excretion routes of tirzepatide metabolites are via urine and feces. Intact tirzepatide is not observed in urine or feces.
Specific Populations
The intrinsic factors of age (18 to 84 years), sex, race (71% White, 11% Asian, 9% American Indian or Alaska Native, and 8% Black or African American), ethnicity, or body weight do not have a clinically relevant effect on the PK of tirzepatide.
Patients with Renal Impairment
Renal impairment does not impact the pharmacokinetics of tirzepatide. The pharmacokinetics of tirzepatide after a single 5 mg dose were evaluated in patients with different degrees of renal impairment (mild, moderate, severe, ESRD) compared with subjects with normal renal function. Data from clinical studies have also shown that renal impairment in patients with overweight or obesity does not impact the pharmacokinetics of tirzepatide [see Use in Specific Populations (8.6)].
Patients with Hepatic Impairment
Hepatic impairment does not impact the pharmacokinetics of tirzepatide. The pharmacokinetics of tirzepatide after a single 5 mg dose were evaluated in patients with different degrees of hepatic impairment (mild, moderate, severe) compared with subjects with normal hepatic function [see Use in Specific Populations (8.7)].
Drug Interaction Studies
Potential for Tirzepatide to Influence the Pharmacokinetics of Other Drugs
In vitro studies have shown low potential for tirzepatide to inhibit or induce CYP enzymes, and to inhibit drug transporters.
ZEPBOUND delays gastric emptying and thereby has the potential to impact the absorption of concomitantly administered oral medications [see Drug Interactions (7.2)].
The impact of tirzepatide on gastric emptying was greatest after a single dose of 5 mg and diminished after subsequent doses.
Following a first dose of tirzepatide 5 mg, acetaminophen maximum concentration (Cmax) was reduced by 55%, and the median peak plasma concentration (tmax) occurred 1 hour later. After coadministration at Week 6 with tirzepatide 15 mg, there was no meaningful impact on acetaminophen Cmax and tmax. Overall acetaminophen exposure (AUC0-24hr) was not influenced.
Following administration of a combined oral contraceptive (0.035 mg ethinyl estradiol and 0.25 mg norgestimate) in the presence of a single dose of tirzepatide 5 mg, mean Cmax of ethinyl estradiol, norgestimate, and norelgestromin was reduced by 59%, 66%, and 55%, while mean AUC was reduced by 20%, 21%, and 23%, respectively. A delay in tmax of 2.5 to 4.5 hours was observed.
Weight Reduction in Adults with Obesity or Overweight, with or without Type 2 Diabetes Mellitus (Study 1 and Study 2)
Overview of Study 1 and Study 2
The efficacy of ZEPBOUND for weight reduction in conjunction with a reduced-calorie diet and increased physical activity was studied in two randomized, double-blind, placebo-controlled fixed-dosage trials (Study 1 and Study 2) in adults aged 18 years and older. In Studies 1 and 2, all patients received a standard lifestyle intervention which included instruction on a reduced-calorie diet (approximately 500 kcal/day deficit) and increased physical activity counseling (recommended minimum of 150 min/week) that began with the first dose of study medication or placebo and continued throughout the trial. Patients also received counseling on behavior modification strategies to adhere to diet and exercise recommendations. In both trials, weight reduction was assessed after 72 weeks of treatment (at least 52 weeks at maintenance dose).
Study 1 (NCT04184622) was a 72-week trial that enrolled 2,539 adult patients with obesity (BMI ≥30 kg/m2), or with overweight (BMI 27 to <30 kg/m2) and at least one weight-related comorbid condition, such as dyslipidemia, hypertension, obstructive sleep apnea, or CV disease; patients with type 2 diabetes mellitus were excluded. Patients were randomized in a 1:1:1:1 ratio to once weekly fixed dosage of ZEPBOUND 5 mg, ZEPBOUND 10 mg, ZEPBOUND 15 mg, or placebo, with an escalation period of up to 20 weeks followed by the maintenance period. At baseline, mean age was 45 years (range 18-84 years), 68% were female, 71% were White, 11% were Asian, 9% were American Indian/Alaska Native, and 8% were Black or African American. A total of 48% were Hispanic or Latino ethnicity. Mean baseline body weight was 104.8 kg and mean BMI was 38 kg/m2. Baseline characteristics included 32% with hypertension, 30% with dyslipidemia, 8% with obstructive sleep apnea, and 3% with CV disease.
Study 2 (NCT04657003) was a 72-week trial that enrolled 938 adult patients with BMI ≥27 kg/m2 and type 2 diabetes mellitus. Patients included in the trial had HbA1c 7-10% and were treated with either diet and exercise alone, or any oral anti-hyperglycemic agent except dipeptidyl peptidase-4 (DPP-4) inhibitors or GLP-1 receptor agonists. Patients who were taking insulin or injectable GLP-1 receptor agonists for type 2 diabetes mellitus were excluded. Patients were randomized in a 1:1:1 ratio to once weekly fixed dosage of ZEPBOUND 10 mg, ZEPBOUND 15 mg, or placebo with an escalation period of up to 20 weeks followed by the maintenance period. At baseline, mean age was 54 years (range 18-85 years), 51% were female, 76% were White, 13% were Asian, and 8% were Black or African American. A total of 60% were Hispanic or Latino ethnicity. Mean baseline body weight was 100.7 kg and mean BMI was 36.1 kg/m2. Baseline characteristics included 66% with hypertension, 61% with dyslipidemia, 8% with obstructive sleep apnea, and 10% with CV disease.
Results for Study 1 and Study 2
The proportions of patients who discontinued study drug in Study 1 were 14.3%, 16.4%, and 15.1% for the 5 mg, 10 mg, and 15 mg ZEPBOUND-treated groups, respectively, and 26.4% for the placebo-treated group. The proportions of patients who discontinued study drug in Study 2 were 9.3% and 13.8% for the 10 mg and 15 mg ZEPBOUND-treated groups, respectively, and 14.9% for the placebo-treated group.
For Studies 1 and 2, weight reduction was assessed after 72 weeks of treatment (at least 52 weeks at maintenance dose). In both studies, the primary efficacy parameters were mean percent change in body weight and the percentage of patients achieving ≥5% weight reduction from baseline to Week 72 (see Table 2).
After 72 weeks of treatment, ZEPBOUND resulted in a statistically significant reduction in body weight compared with placebo, and greater proportions of patients treated with ZEPBOUND 5 mg, 10 mg, and 15 mg achieved at least 5% weight reduction compared to placebo. Among patients treated with ZEPBOUND 10 mg and 15 mg, greater proportions of patients achieved at least 10%, 15%, and 20% weight reduction compared to placebo (see Table 2). A reduction in body weight was observed with ZEPBOUND irrespective of age, sex, race, ethnicity, baseline BMI, and glycemic status.
Table 2: Changes in Body Weight at Week 72 in Studies 1 and 2 in Patients with Obesity or Overweight
|
|
|
|
|
|
| Study 1 | Study 2 |
Intention-to-Treat (ITT) Populationa |
Placebo
N = 643 | ZEPBOUND
5 mg
N = 630 | ZEPBOUND
10 mg
N = 636 | ZEPBOUND
15 mg
N = 630 |
Placebo
N = 315 | ZEPBOUND
10 mg
N = 312 | ZEPBOUND
15 mg
N = 311 |
| Body Weight
| | | | | | | |
| Baseline mean (kg)
| 104.8
| 102.9
| 105.8
| 105.6
| 101.7
| 100.9
| 99.6
|
| % Change from baselineb | -3.1
| -15.0
| -19.5
| -20.9
| -3.2
| -12.8
| -14.7
|
% Difference from placebob
(95% CI)
| | -11.9
(-13.4, -10.4)d | -16.4
(-17.9, -14.8)d | -17.8
(-19.3, -16.3)d | | -9.6
(-11.1, -8.1)d | -11.6
(-13.0, -10.1)d |
| % of Patients losing ≥5% body weight
| 34.5
| 85.1
| 88.9
| 90.9
| 32.5
| 79.2
| 82.8
|
% Difference from placebo
(95% CI)
| | 50.3
(44.3, 56.2)c,d | 54.6
(49.1, 60.0)c,d | 56.4
(50.9, 62.0)c,d | | 46.8
(39.5, 54.1)c,d | 50.4
(43.1, 57.8)c,d |
| % of Patients losing ≥10% body weight
| 18.8
| 68.5
| 78.1
| 83.5
| 9.5
| 60.5
| 64.8
|
% Difference from placebo
(95% CI)
| | 49.3
(43.6, 54.9)c,e | 59.5
(54.2, 64.9)c,d | 64.8
(59.6, 70.1)c,d | | 51.0
(44.4, 57.7)c,d | 55.3
(48.6, 62.0)c,d |
| % of Patients losing ≥15% body weight
| 8.8
| 48.0
| 66.6
| 70.6
| 2.7
| 39.7
| 48.0
|
% Difference from placebo
(95% CI)
| | 38.7
(33.6, 43.7)c,e | 58.1
(53.2, 63.0)c,d | 62.0
(57.2, 66.8)c,d | | 37.0
(31.1, 42.9)c,d | 45.4
(39.4, 51.4)c,d |
| % of Patients losing ≥20% body weight
| 3.1
| 30.0
| 50.1
| 56.7
| 1.0
| 21.5
| 30.8
|
% Difference from placebo
(95% CI)
| | 26.6
(22.4, 30.7)c,e | 47.3
(42.7, 51.9)c,d | 53.8
(49.3, 58.3)c,d | | 20.5
(15.7, 25.4)c,d | 29.7
(24.3, 35.0)c,d |
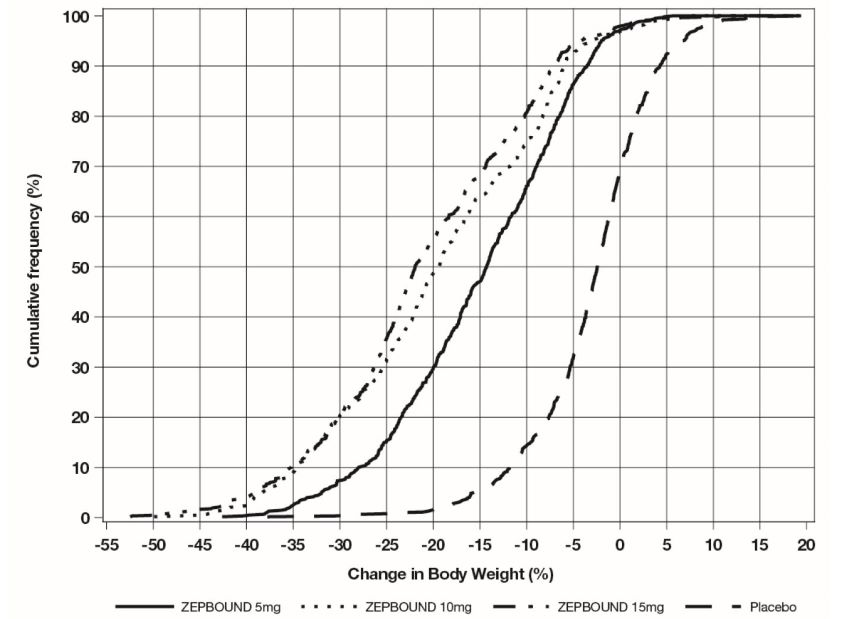
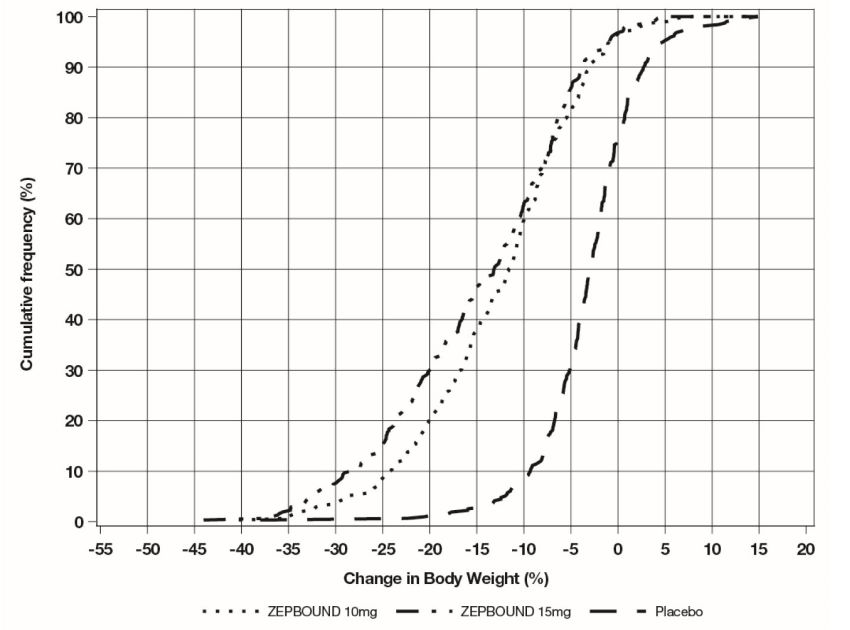
The cumulative frequency distributions of change in body weight are shown in Figure 1 for Study 1 and Figure 2 for Study 2. One way to interpret this figure is to select a change in body weight of interest on the horizontal axis and note the corresponding proportions of patients (vertical axis) in each treatment group who achieved at least that degree of weight reduction. For example, note that the vertical line arising from -10% in Figure 1 intersects the ZEPBOUND 15 mg and placebo curves at approximately 83.5%, and 18.8%, respectively, which correspond to the values shown in Table 2.
Figure 1: Changes in Body Weight (%) from Baseline to Week 72 in Study 1 in Patients with Obesity or Overweight (without Type 2 Diabetes)

Figure 1 (Zep Uspi Fig1 V1)
Note: Based on average percent weight change of each randomized patient within each specific treatment arm from 100 imputed datasets including observed data and imputed data using hybrid approach for missing values.
Figure 2: Changes in Body Weight (%) from Baseline to Week 72 in Study 2 in Patients with Obesity or Overweight and Type 2 Diabetes
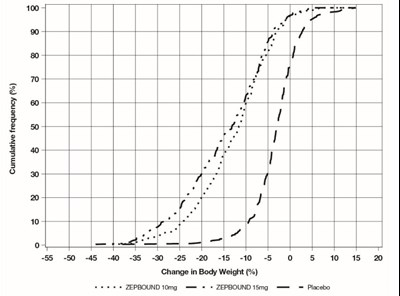
Figure 2 (Zep Uspi Fig2 V1)
Note: Based on average percent weight change of each randomized patient within each specific treatment arm from 100 imputed datasets including observed data and imputed data using hybrid approach for missing values.
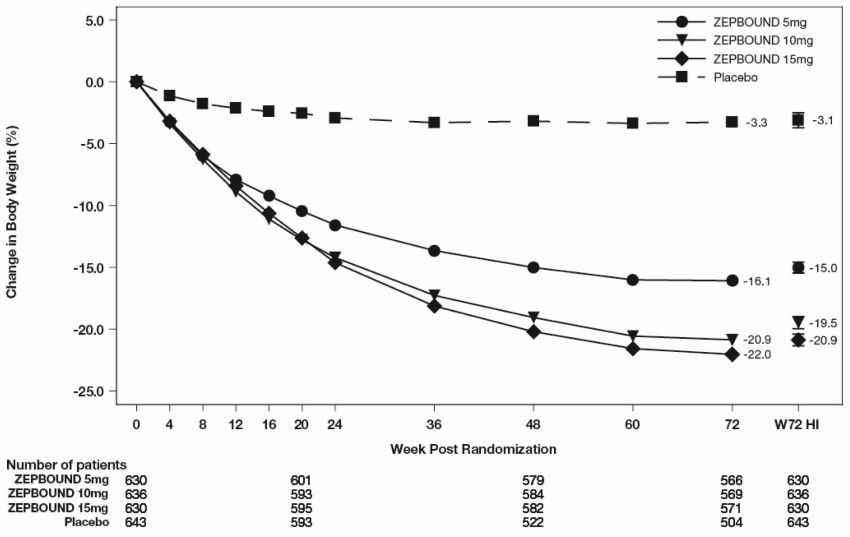
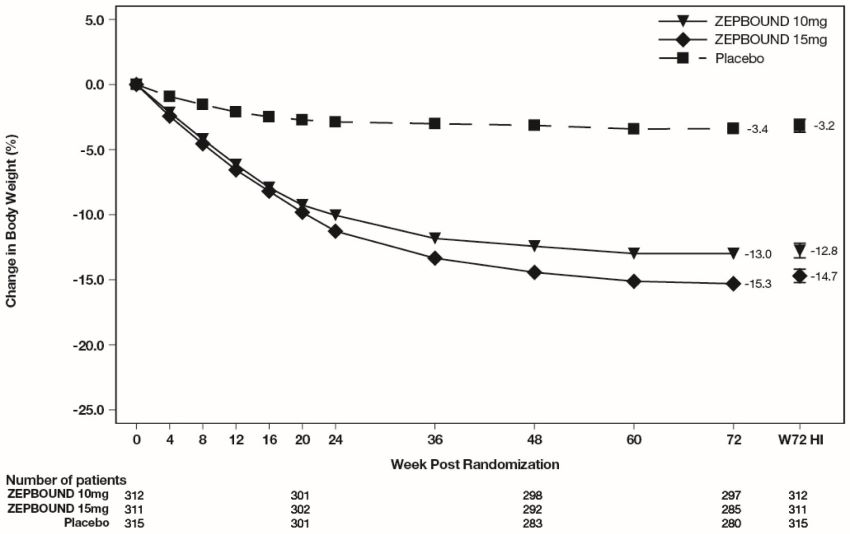
The time courses of weight reduction with ZEPBOUND and placebo from baseline through Week 72 are depicted in Figure 3 for Study 1 and Figure 4 for Study 2.
Figure 3: Change from Baseline (%) in Body Weight in Study 1 in Patients with Obesity or Overweight (without Type 2 Diabetes)
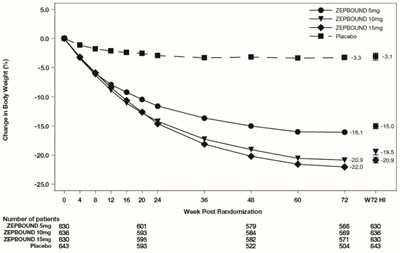
Figure 3 (Zep Uspi Fig3 V1)
Note: Displayed results are from the Intent-to-Treat Population. (1) Observed mean value from Week 0 to Week 72, and (2) least-squares mean ± standard error at Week 72 hybrid imputation (HI).
Figure 4: Change from Baseline (%) in Body Weight in Study 2 in Patients with Obesity or Overweight and Type 2 Diabetes
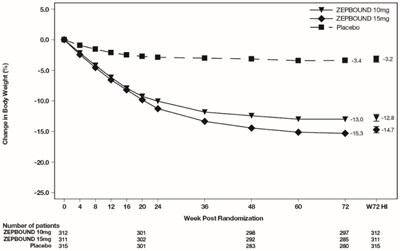
Figure 4 (Zep Uspi Fig4 V1)
Note: Displayed results are from the Intent-to-Treat Population. (1) Observed mean value from Week 0 to Week 72, and (2) least squares mean ± standard error at Week 72 hybrid imputation (HI).
Changes in waist circumference and cardiometabolic parameters with ZEPBOUND are shown in Table 3 for Study 1 and Study 2.
Table 3: Changes in Anthropometry and Cardiometabolic Parameters at Week 72 in Studies 1 and 2 in Patients with Obesity or Overweight
|
|
|
|
|
|
|
|
| Study 1 | Study 2 |
Intention-to-Treat (ITT) Populationa |
Placebo
N = 643 | ZEPBOUND
5 mg
N = 630 | ZEPBOUND
10 mg
N = 636 | ZEPBOUND
15 mg
N = 630 |
Placebo
N = 315 | ZEPBOUND
10 mg
N = 312 | ZEPBOUND
15 mg
N = 311 |
| Waist Circumference (cm)
| | | | | | | |
| Baseline mean
| 114.0
| 113.2
| 114.8
| 114.4
| 116.0
| 114.2
| 114.6
|
| Change from baselineb | -4.0
| -14.0
| -17.7
| -18.5
| -3.3
| -10.8
| -13.1
|
Difference from
placebob (95% CI)
| | -10.1
(-11.6, -8.6)e | -13.8
(-15.2, -12.3)d | -14.5
(-15.9, -13.0)d | | -7.4
(-9.0, -5.9)d | -9.8
(-11.2, -8.3)d |
| Systolic Blood Pressure (mmHg)
| | | | | | | |
| Baseline mean
| 122.9
| 123.6
| 123.8
| 123.0
| 131.0
| 130.6
| 130.0
|
| Change from baselineb | -1.0
| -6.6
| -7.7
| -7.4
| -1.2
| -5.6
| -7.1
|
Difference from
placebob (95% CI)
| | -5.6
(-7.2, -3.9)e | -6.7
(-8.4, -5.0)e | -6.4
(-8.0, -4.8)e | | -4.4
(-6.7, -2.1)e | -5.9
(-8.3, -3.6)e |
| Diastolic Blood Pressure (mmHg)
| | | | | | | |
| Baseline mean
| 79.6
| 79.3
| 79.9
| 79.3
| 79.4
| 80.2
| 79.7
|
| Change from baselineb | -0.8
| -4.9
| -5.0
| -4.5
| -0.3
| -2.1
| -2.9
|
Difference from
placebob (95% CI)
| | -4.1
(-5.2, -3.0)e | -4.2
(-5.3, -3.0)e | -3.7
(-4.8, -2.7)e | | -1.8
(-3.3, -0.4)e | -2.7
(-4.2, -1.2)e |
| Pulse Rate (beats per minute)
| | | | | | | |
| Baseline mean
| 72.9
| 72.4
| 71.8
| 72.4
| 74.8
| 75.9
| 75.6
|
| Change from baselinef | 0.1
| 0.6
| 2.3
| 2.6
| -0.5
| 0.6
| 1.0
|
Difference from
placebof (95% CI)
| | 0.5
(-0.5, 1.5)e | 2.2
(1.2, 3.2)e | 2.5
(1.5, 3.4)e | | 1.2
(-0.1, 2.5)e | 1.5
(0.2, 2.8)e |
| Total Cholesterol (mg/dL)
| | | | | | | |
| Baseline meang | 187.5
| 187.1
| 190.6
| 187.5
| 174.9
| 173.9
| 167.0
|
% change from
baselineb | -1.8
| -3.8
| -4.4
| -6.3
| 2.8
| -2.8
| -1.0
|
Relative difference
from placebob (95% CI)
| | -2.1
(-4.5, 0.4)c,e | -2.7
(-5.1, -0.2)c,e | -4.6
(-6.8, -2.2)c,e | | -5.5
(-8.7, -2.2)c,e | -3.8
(-7.1, -0.3)c,e |
| LDL Cholesterol (mg/dL)
| | | | | | | |
| Baseline meang | 109.4
| 108.7
| 112.3
| 109.3
| 92.4
| 90.5
| 85.7
|
% change from
baselineb | -1.7
| -4.6
| -5.6
| -7.1
| 7.4
| 1.8
| 4.1
|
Relative difference
from placebob (95% CI)
| | -2.9
(-6.6, 0.9)c,e | -4.0
(-7.5, -0.5)c,e | -5.5
(-8.9, -2.0)c,e | | -5.2
(-10.1, 0.1)c,e | -3.0
(-8.4, 2.6)c,e |
| HDL Cholesterol (mg/dL)
| | | | | | | |
| Baseline meang | 46.6
| 47.6
| 47.6
| 47.6
| 42.7
| 43.8
| 42.2
|
% change from
baselineb | -0.7
| 6.9
| 9.2
| 8.0
| 0.2
| 8.2
| 9.7
|
Relative difference
from placebob (95% CI)
| | 7.7
(4.6, 10.8)c,e | 9.9
(6.7, 13.2)c,e | 8.7
(5.7, 11.8)c,e | | 8.0
(4.2, 11.8)c,e | 9.5
(5.6, 13.5)c,e |
| Non-HDL Cholesterol (mg/dL)
| | | | | | | |
| Baseline meang | 138.3
| 137.0
| 140.4
| 137.5
| 129.6
| 127.2
| 121.9
|
% change from
baselineb | -2.3
| -8.0
| -9.4
| -11.7
| 3.7
| -6.6
| -5.2
|
Relative difference
from placebob (95% CI)
| | -5.8
(-8.9, -2.6)c,e | -7.2
(-10.3, -4.1)c,e | -9.6
(-12.4, -6.6)c,e | | -9.9
(-14.1, -5.6)c,e | -8.5
(-12.9, -4.0)c,e |
| Triglycerides (mg/dL)
| | | | | | | |
| Baseline meang | 130.8
| 128.7
| 125.7
| 128.1
| 165.0
| 158.8
| 158.5
|
% change from
baselineb | -5.6
| -21.2
| -23.8
| -29.1
| -3.3
| -27.1
| -27.3
|
Relative difference
from placebob (95% CI)
| | -16.5
(-21.2, -11.4)c,e | -19.3
(-23.9, -14.4)c,e | -24.9
(-29.1, -20.4)c,e | | -24.6
(-30.0, -18.7)c,e | -24.8
(-30.3, -18.9)c,e |
| HbA1c (%)
| | | | | | | |
| Baseline mean
| 5.6
| 5.6
| 5.5
| 5.6
| 8.0
| 8.0
| 8.1
|
| Change from baselineb | -0.1
| -0.4
| -0.4
| -0.4
| -0.5
| -2.1
| -2.1
|
Difference from
placebob (95% CI)
| | -0.3
(-0.3, -0.2)e | -0.4
(-0.4, -0.3)e | -0.4
(-0.4, -0.3)e | | -1.6
(-1.7, -1.4)d | -1.6
(-1.8, -1.4)d |
Weight Reduction Following Intensive Lifestyle Intervention in Adults with Obesity or Overweight (Study 3)
Overview of Study 3
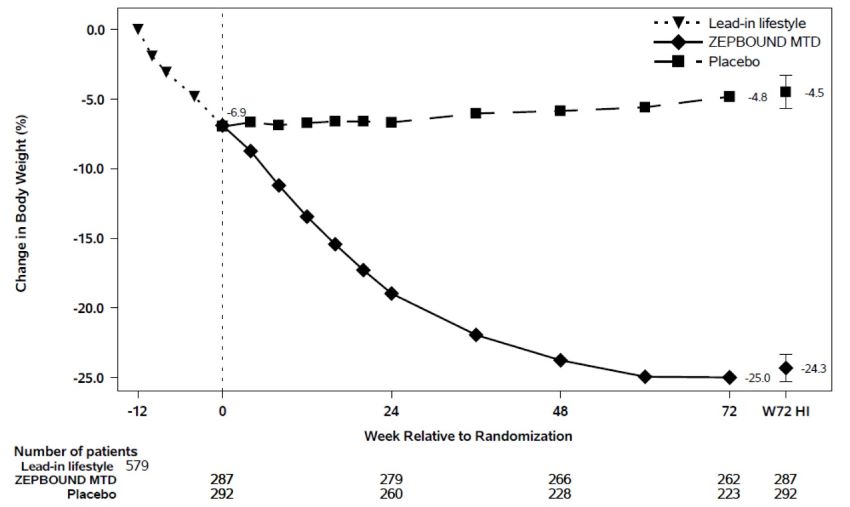
Study 3 (NCT04657016) was an 84-week trial with a 12-week intensive lifestyle intervention lead-in period (Week -12 to Week 0), followed by a 72-week randomized treatment period of ZEPBOUND versus placebo (Week 0 to Week 72) with a standard lifestyle intervention. Only patients who lost ≥5% body weight during the 12-week intensive lifestyle lead-in period entered the 72-week randomized treatment period. The trial initially enrolled 806 adult patients (aged 18 years and older) with obesity (BMI ≥30 kg/m2), or with overweight (BMI 27 to <30 kg/m2) and at least one weight-related comorbid condition, such as dyslipidemia, hypertension, obstructive sleep apnea, or CV disease; patients with type 2 diabetes mellitus were excluded. During the intensive lifestyle intervention lead-in period, lifestyle instruction was delivered 8 times over 12 weeks by a dietician or dietician-equivalent, with all patients receiving instruction to exercise for at least 150 minutes per week and to reduce their caloric intake to approximately 1,200 kcal/day (females) or 1,500 kcal/day (males). Patients also received counseling on behavior modification strategies to adhere to diet and exercise recommendations. At the end of the 12-week intensive lifestyle intervention lead-in period, 579 patients who achieved ≥5% weight reduction were randomized in a 1:1 ratio to ZEPBOUND or placebo for 72 weeks. ZEPBOUND dosages were escalated over a period of up to 20 weeks to a maximum tolerated dosage (MTD) of 10 mg or 15 mg subcutaneous once weekly. During the randomized treatment period, patients received a standard lifestyle instruction every 12 weeks on reduced-calorie diet (approximately 500 kcal/day deficit) and increased physical activity (recommended minimum of 150 min/week) that began with the first dose of ZEPBOUND or placebo and continued throughout the 72-week treatment period; behavior modification strategies were recommended as needed. Weight reduction was assessed after 72 weeks of treatment (at least 52 weeks at maintenance dose).
For the 579 patients who were randomized, mean body weight at enrollment prior to entering the 12-week lifestyle lead-in period (Week -12) was 109.5 kg and mean BMI was 38.6 kg/m2. At randomization (Week 0), after the 12-week intensive lifestyle lead-in period, mean body weight was 101.9 kg and mean BMI was 35.9 kg/m2. The mean age of patients randomized to treatment was 46 years (range 18-77 years), 63% were female, 86% were White, 11% were Black or African American, and 1% were Asian. A total of 54% were Hispanic or Latino ethnicity. Baseline characteristics for the 579 randomized patients included 34% with hypertension, 26% with dyslipidemia, 10% with obstructive sleep apnea, and 2% with CV disease.
Results for Study 3
At the end of the 12-week intensive lifestyle intervention lead-in, for patients who subsequently entered the randomized treatment period (n=579), the average body weight loss due to lifestyle was 6.9% (Week -12 to Week 0). Eighty-six percent (86%) of ZEPBOUND-treated patients had a maximum tolerated dosage of 15 mg weekly based on their final dose during the double-blind treatment period. The time course of weight reduction during the lead-in and from Week 0 to Week 72 with ZEPBOUND and placebo are depicted in Figure 5.
Figure 5: Change in Body Weight (%) After 12-Week Intensive Lifestyle Intervention Lead-In Followed by Randomized Treatment and a Standard Lifestyle Intervention (Study 3) in Patients with Obesity or Overweight
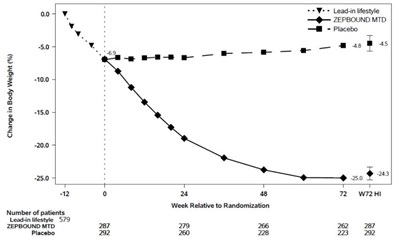
Figure 5 (Zep Uspi Fig5 V1)
Note: Displayed results are from the randomized Population. (1) Observed mean value from Week -12 to Week 72, and (2) least squares mean ± standard error at Week 72 hybrid imputation (HI). Change from Week -12 is not a primary endpoint in Study 3.
The proportions of patients who discontinued study drug after randomization were 21.3% for the ZEPBOUND-treated group and 30.5% for the placebo-treated group.
For Study 3, the primary efficacy parameters were mean percent change in body weight from randomization (Week 0) to Week 72 and the percentage of patients achieving ≥5% weight reduction from randomization (Week 0) to Week 72. Amongst randomized patients who already lost ≥5% body weight during the 12-week intensive lifestyle lead-in period, subsequent treatment with ZEPBOUND resulted in a statistically significant reduction in body weight compared to placebo from randomization (Week 0) to Week 72. A greater proportion of patients treated with ZEPBOUND achieved at least 5%, 10%, 15%, and 20% weight reduction from Week 0 to Week 72 compared to placebo (see Table 4).
Table 4: Changes in Body Weight After 12-Week Intensive Lifestyle Intervention Lead-In Followed by Randomized Treatment and a Standard Lifestyle Intervention (Study 3) in Patients with Obesity or Overweight
|
|
|
|
|
|
| Study 3
N = 579a |
| Body Weight
| |
| Mean (kg) at Week -12
| 109.5
|
| Intention-to-Treat (ITT) Populationa,b |
Placebo
N = 292 | ZEPBOUND
MTD (10 mg or 15 mg)
N = 287 |
| Body Weight
| | |
| Mean (kg) at Week 0
| 101.3
| 102.5
|
| % Change from randomization at Week 72c | 2.5
| -18.4
|
% Difference from placebo, at Week 72c
(95% CI)
| | -20.8
(-23.2, -18.5)e |
| % of Patients losing ≥5% body weight
| 16.5
| 87.5
|
% Difference from placebo
(95% CI)
| | 71.1
(63.6, 78.5)d,e |
| % of Patients losing ≥10% body weight
| 8.9
| 76.7
|
% Difference from placebo
(95% CI)
| | 67.9
(60.7, 75.1)d,e |
| % of Patients losing ≥15% body weight
| 4.2
| 65.4
|
% Difference from placebo
(95% CI)
| | 61.3
(54.5, 68.1)d,e |
| % of Patients losing ≥20% body weight
| 2.2
| 44.7
|
% Difference from placebo
(95% CI)
| | 42.6
(36.0, 49.1)d,e |
Changes in waist circumference and cardiometabolic parameters are shown in Table 5.
Table 5: Changes in Anthropometry and Cardiometabolic Parameters After 12-Week Intensive Lifestyle Intervention Lead-In Followed by Randomized Treatment and a Standard Lifestyle Intervention (Study 3) in Patients with Obesity or Overweight
|
|
|
|
|
|
|
|
|
| Intention-to-Treat (ITT) Populationa | All Randomized Patients
N=579 | Placebo
N=292 | ZEPBOUND MTD (10 mg or 15 mg)
N=287 |
| Baseline (Week
-12) | Change from Week
-12 to Week 0 | Randomization (Week 0) | Change from Week 0 to Week 72 | Randomization (Week 0) | Change from Week 0 to Week 72 | Difference from placebo, Week 0 to Week 72
(95% CI) |
| Waist circumference (cm)h | 116.1
| -6.7
| 109.6
| 0.2b | 109.3
| -14.6b | -14.8b
(-17.2, -12.5)d |
| Systolic Blood Pressure (mmHg)h | 126.2
| -5.0
| 120.8
| 3.5b | 121.7
| -5.1b | -8.6b
(-11.3, -6.0)e |
| Diastolic Blood Pressure (mmHg)h | 81.7
| -2.9
| 78.3
| 2.1b | 79.3
| -3.2b | -5.3b
(-6.9, -3.7)e |
| Pulse Rate (beats per minute)h | 73.0
| -1.6
| 70.7
| 0.9f | 72.2
| 2.7f | 1.8f
(0.3, 3.4)e |
| HbA1c (%)h | 5.5
| -0.1
| 5.4
| 0.0b | 5.3
| -0.4b | -0.4b
(-0.5, -0.3)e |
| Total Cholesterol (mg/dL)g,h | 190.2
| -8.6
| 181.6
| 4.3
| 181.7
| -2.4
| -6.4b
(-9.0, -3.6)c,e |
| LDL Cholesterol (mg/dL)g,h | 111.6
| -3.5
| 107.5
| 4.4
| 108.0
| -5.6
| -9.6b
(-13.7, -5.4)c,e |
| HDL Cholesterol (mg/dL)g,h | 48.4
| -1.2
| 47.8
| 5.4
| 46.9
| 15.2
| 9.3b
(4.5, 14.2)c,e |
| Non-HDL Cholesterol (mg/dL)g,h | 139.2
| -7.4
| 131.5
| 4.4
| 132.4
| -8.8
| -12.6b
(-15.9, -9.3)c,e |
| Triglycerides (mg/dL)g,h | 123.1
| -19.8
| 108.8
| 2.1
| 111.7
| -23.5
| -25.1b
(-30.9, -18.9)c,e |
Weight Reduction Following Randomized Withdrawal in Adults with Obesity or Overweight (Study 4)
Overview of Study 4
Study 4 (NCT04660643) was an 88-week randomized withdrawal trial in which all patients received open-label ZEPBOUND during a 36-week lead-in period, followed by randomization to either continue ZEPBOUND or switch to placebo for 52 weeks. The trial enrolled 783 adult patients (aged 18 years and older) with obesity (BMI ≥30 kg/m2), or with overweight (BMI 27 to <30 kg/m2) and at least one weight-related comorbid condition, such as dyslipidemia, hypertension, obstructive sleep apnea, or CV disease; patients with type 2 diabetes mellitus were excluded. All patients received a standard lifestyle intervention which included instruction on a reduced-calorie diet (approximately 500 kcal/day deficit) and increased physical activity counseling (recommended minimum of 150 min/week) that began with the first dose of ZEPBOUND, during the lead-in period, and continued throughout the trial. During the 36-week open-label ZEPBOUND lead-in period, ZEPBOUND dosages were escalated over a period of up to 20 weeks to an MTD of 10 mg or 15 mg subcutaneous once weekly. After the lead-in period, patients were randomized at Week 36 to continue ZEPBOUND or switch to placebo for 52 weeks.
Of the 783 patients who started ZEPBOUND at Week 0, 14.4% discontinued treatment before randomization at Week 36, and adverse events were the most common reason for discontinuation (6.8%). At Week 36, a total of 670 patients were randomized in a 1:1 ratio to ZEPBOUND MTD or placebo for 52 weeks. For the 670 randomized patients, at study entry (Week 0) mean body weight was 107.3 kg and mean BMI was 38.4 kg/m2, and at randomization (Week 36, after the open-label ZEPBOUND lead-in period) mean body weight was 85.2 kg and mean BMI was 30.5 kg/m2. Among the randomized patients, the mean age was 49 years (range 19-81 years), 71% were female, 80% were White, 11% were Black or African American, and 7% were Asian. A total of 44% were Hispanic or Latino ethnicity. Baseline characteristics for the 670 randomized patients included 35% with hypertension, 32% with dyslipidemia, 12% with obstructive sleep apnea, and 6% with CV disease.
Results for Study 4
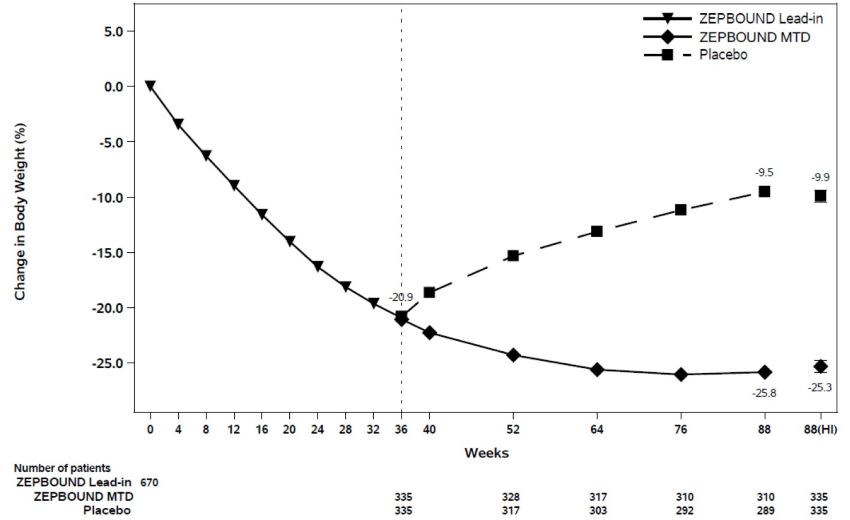
At the end of the 36-week open-label ZEPBOUND lead-in period, of the 670 randomized patients, 93% were on ZEPBOUND MTD of 15 mg weekly and 7% were on MTD of 10 mg weekly. After open-label ZEPBOUND treatment, randomized patients (n=670) had an average body weight loss of 20.9% (Week 0 to Week 36). The time course of weight reduction from Week 0 through Week 88 is depicted in Figure 6.
Figure 6: Change in Body Weight (%) After 36-Week Open-Label Treatment Followed by Randomized Withdrawal (Study 4) in Patients with Obesity or Overweight
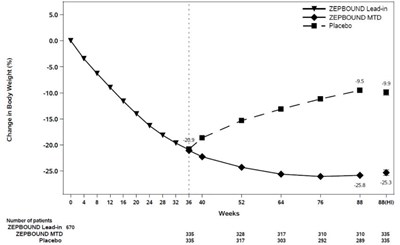
Figure 6 (Zep Uspi Fig6 V1)
Note: Displayed results are from the randomized population. (1) Displayed results are observed mean value from Week 0 to Week 88 and (2) least squares mean ± standard error at Week 88 hybrid imputation (HI). Change from Week 0 was not a primary endpoint in Study 4.
The proportions of patients who discontinued study drug after randomization at Week 36 were 10.4% for the ZEPBOUND-treated group and 17.9% for the placebo-treated group.
For Study 4, the primary efficacy parameter was mean percent change in body weight from randomization (Week 36) to Week 88. After weight loss with ZEPBOUND treatment during the open-label lead-in period (Week 0 to Week 36), continued treatment with ZEPBOUND from randomization (Week 36) to Week 88 resulted in a statistically significant reduction in body weight compared with placebo (see Table 6).
Table 6: Changes in Body Weight After 36-Week Open-Label Treatment Followed by Randomized Withdrawal (Study 4) in Patients with Obesity or Overweight
|
|
|
|
| Study 4
N=670a |
| Body Weight
| |
| Mean at Week 0 (kg)
| 107.3
|
| Intention-to-Treat (ITT) Populationa | Placebo
N=335 | ZEPBOUND
(MTD 10 mg or 15 mg)
N=335 |
| Body Weight
| | |
| Mean at Week 36 (kg)
| 85.8
| 84.6
|
| % change from Week 36 at Week 88b | 14.0
| -5.5
|
% difference from placebo at Week 88
(95% CI)b | | -19.4
(-21.2, -17.7)c |
Changes in waist circumference and cardiometabolic parameters in Study 4 are shown in Table 7.
Table 7: Mean Changes in Anthropometry and Cardiometabolic Parameters After 36-Week Open-Label Treatment Followed by Randomized Withdrawal (Study 4) in Patients with Obesity or Overweight
|
|
|
|
|
|
|
|
|
| Intention-to-Treat (ITT) Populationa | All Randomized Patients
N=670 | Placebo
N=335 | ZEPBOUND MTD (10 mg or 15 mg)
N=335 |
| Baseline (Week 0) | Change from Week 0 to Week 36 | Randomization (Week 36) | Change from Week 36 to Week 88 | Randomization (Week 36) | Change from Week 36 to Week 88 | Difference from placebo, Week 36 to Week 88
(95% CI) |
| Waist circumference (cm)h | 115.2
| -17.8
| 98.2
| 7.8b | 96.8
| -4.3b | -12.1b
(-13.5, -10.6)d |
| Systolic Blood Pressure (mmHg)h | 126.1
| -11.2
| 114.8
| 8.2b | 115.0
| 2.0b | -6.2b
(-8.2, -4.3)e |
| Diastolic Blood Pressure (mmHg)h | 80.9
| -5.1
| 76.2
| 3.2b | 75.4
| -0.7b | -3.8b
(-5.2, -2.4)e |
| Pulse Rate (beats per minute)h | 72.5
| 5.0
| 77.8
| -5.2f | 77.1
| -2.1f | 3.1f
(1.9, 4.3)e |
| HbA1c (%)h | 5.5
| -0.5
| 5.0
| 0.3b | 5.1
| -0.0b | -0.3b
(-0.3, -0.2)e |
| Total Cholesterol (mg/dL)g,h | 188.3
| -12.4
| 176.1
| 8.0
| 175.9
| 2.7
| -4.9b
(-7.4, -2.4)c,e |
| LDL Cholesterol (mg/dL)g,h | 108.6
| -1.9
| 107.6
| 3.2
| 105.9
| -3.5
| -6.5b
(-10.0, -2.9)c,e |
| HDL Cholesterol (mg/dL)g,h | 49.9
| -2.7
| 47.3
| 14.8
| 47.7
| 18.7
| 3.4b
(0.2, 6.6)c,e |
| Non-HDL Cholesterol (mg/dL)g,h | 135.8
| -9.8
| 126.3
| 5.1
| 126.0
| -3.4
| -8.1b
(-11.3, -4.8)c,e |
| Triglycerides (mg/dL)g,h | 121.4
| -40.4
| 85.5
| 13.5
| 90.9
| -4.8
| -16.1b
(-21.7, -10.0)c,e |
Overview of Study
5
and Study
6
The efficacy of ZEPBOUND for moderate to severe obstructive sleep apnea (OSA) (apnea-hypopnea index [AHI] ≥15) in patients with obesity (BMI ≥30 kg/m2) was evaluated in a master protocol clinical trial (NCT05412004) that included two randomized, double-blind, placebo-controlled trials (Study 5 and Study 6) of 52 weeks duration. The two trials enrolled a total of 469 adult patients.
In Studies 5 and 6, patients were randomized in a 1:1 ratio to receive ZEPBOUND or placebo for 52 weeks. ZEPBOUND dosages were escalated over a period of up to 20 weeks to maximum tolerated dosage (MTD) of 10 mg or 15 mg subcutaneous once weekly [see Dosage and Administration (2.1, 2.2)]. Patients with type 2 diabetes mellitus were excluded and all patients received instruction on a reduced-calorie diet and increased physical activity counseling throughout the study.
Study 5 enrolled 234 adult patients with moderate to severe OSA and obesity who were unable or unwilling to use Positive Airway Pressure (PAP) therapy. Patients had a mean age of 48 years (range: 20 to 76 years), 67% were male, 66% were White, 20% were Asian, 8% were American Indian/Alaska Native, and 6% were Black or African American. A total of 42% were Hispanic or Latino ethnicity.
Study 6 enrolled 235 adult patients with moderate to severe OSA and obesity who were on PAP therapy. Patients had a mean age of 52 years (range: 26 to 79 years), 72% were male, 73% were White, 14% were Asian, 8% were American Indian/Alaska Native, and 5% were Black or African American. A total of 32% were Hispanic or Latino ethnicity.
Table 8 describes the baseline disease characteristics of patients in Studies 5 and 6.
Table 8: Baseline Disease Characteristics of Patients with OSA and Obesity in Study 5 and Study 6
|
|
|
| Study 5 (N=234) | Study 6 (N=235) |
| Baseline AHI (events/hour), mean (SD)
| 51.5 (31)
| 49.5 (26.7)
|
| Moderate OSA, %a | 35.2
| 30.9
|
| Severe OSA, %b | 63.1
| 68.2
|
| ESS Total, mean (SD)
| 10.5 (5.2)
| 10 (4.6)
|
| Total Hypoxic Burden (% min/hour), mean (SD)
| 208.4 (189.1)
| 193 (174.6)
|
| BMI (kg/m2), mean (SD)
| 39.1 (7)
| 38.7 (6)
|
| Pre-diabetes, %
| 65
| 56.6
|
| Hypertension, %
| 75.6
| 77.4
|
| Cardiac disorders, %
| 10.3
| 11.1
|
| Dyslipidemia, %
| 80.8
| 83.8
|
Results for Study 5 and Study 6
The primary endpoint for Studies 5 and 6 was the change from baseline in the apnea-hypopnea index (AHI) at Week 52. Patients in Study 5 were unable or unwilling to use PAP therapy, and patients in Study 6 were on PAP therapy and instructed to suspend PAP for 7 days prior to assessment of the primary endpoint. The clinical studies for OSA did not evaluate the timing or appropriateness of PAP discontinuation in patients who were previously compliant with PAP therapy.
In Studies 5 and 6, treatment with ZEPBOUND for 52 weeks resulted in a statistically significant reduction in AHI compared with placebo, and greater proportions of patients treated with ZEPBOUND achieved remission or mild non-symptomatic OSA compared to placebo. Table 9 provides the efficacy results for Studies 5 and 6. A reduction in AHI was observed with ZEPBOUND irrespective of age, sex, ethnicity, baseline BMI, or baseline OSA severity. In both Studies 5 and 6, patients treated with ZEPBOUND achieved a greater reduction in systolic blood pressure and high-sensitivity C-reactive protein levels compared to placebo.
Table 9: Changes in Apnea-Hypopnea Index (AHI), Hypoxic Burden, and Body Weight at Week 52 in Study 5 and Study 6
|
|
|
|
|
|
|
| Modified Intent-to-Treat (mITT) Populationa | Study 5 | Study 6 |
Placebo
N = 120 | ZEPBOUND MTD (10 mg or 15 mg)
N = 114 | Placebo
N = 114 | ZEPBOUND MTD (10 mg or 15 mg)
N = 119 |
| AHI (events/hr)
|
| Baseline mean
| 50.1
| 52.9
| 53.1
| 46.1
|
| Change from baselineb | -5.3
| -25.3
| -5.5
| -29.3
|
| Difference from placebob (95% CI)
| -20 (-25.8, -14.2)e | -23.8 (-29.6, -17.9)e |
| % change in AHI
|
| % change from baselineb | -3
| -50.7
| -2.5
| -58.7
|
| % difference from placebob (95% CI)
| -47.7 (-65.8, -29.6)e | -56.2 (-73.7, -38.7)e |
| % of patients with ≥50% reduction in AHId | 19
| 61.2
| 23.3
| 72.4
|
| % difference from placebo (95% CI)
| 42.8 (30.8, 54.8)e | 48.6 (36.6, 60.7)e |
| Remission or mild non-symptomatic OSA
|
| % of Patients with AHI <5 or AHI 5-14 and ESS≤10d | 15.9
| 42.2
| 14.3
| 50.2
|
| % difference from placebo (95% CI)
| 28.7 (18.3, 39.2)e | 33.2 (22.1, 44.3)e |
| Sleep apnea-specific hypoxic burden (% min/h)
|
| Baseline meanf | 137.8
| 153.6
| 142.1
| 132.2
|
| Change from baselineb | -25.1
| -95.2
| -41.7
| -103
|
| Difference from placebob (95% CI)
| -70.1 (-90.9, -49.3)c,e | -61.3 (-84.7, -37.9)c,e |
| Body weight (kg)
|
| Baseline mean
| 112.8
| 116.7
| 115.1
| 115.8
|
| % change from baselineb | -1.6
| -17.7
| -2.3
| -19.6
|
| % difference from placebob (95% CI)
| -16.1 (-18, -14.2)e | -17.3 (-19.3, -15.3)e |
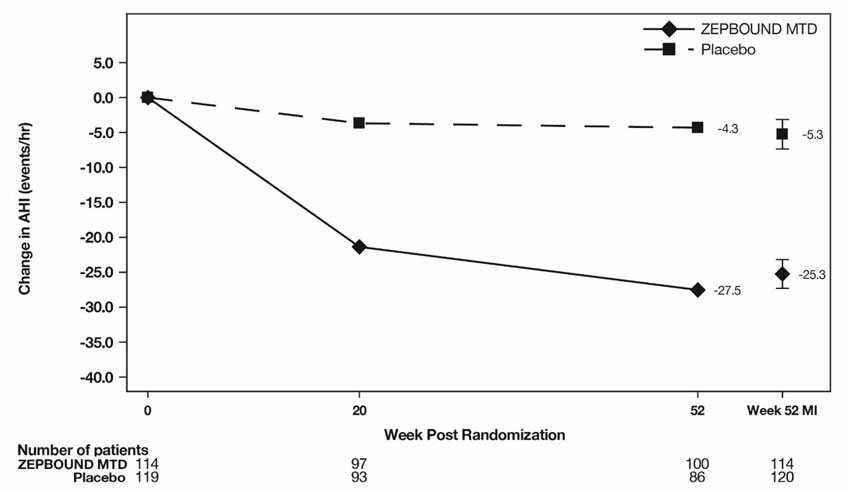
The time course of change in AHI with ZEPBOUND and placebo from baseline through Week 52 are shown in Figure 7 for Study 5. Similar results were demonstrated for Study 6.
Figure 7: Change from Baseline in Apnea-Hypopnea Index (AHI) Through Week 52 (Study 5)
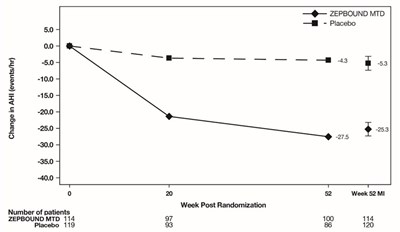
Figure 7 (Zep Uspi Fig7 V1)
Abbreviations: AHI = Apnea-Hypopnea Index; ANCOVA = analysis of covariance; MI = multiple imputation; MTD = maximum tolerated dose.
Note: Displayed results are from modified Intent-to-Treat Population. (1) Observed mean value from Week 0 through Week 52, and (2) least squares mean ± standard error at Week 52 from ANCOVA adjusted for baseline values and stratification factors, with multiple imputation of missing data.
Sleep-Related Impairment
In OSA clinical studies (Study 5 and Study 6), ZEPBOUND-treated patients showed improvement in sleep-related impairment compared to those who received placebo. Sleep-related impairment was assessed using the Patient-Reported Outcomes Measurement Information System® (PROMIS) Short Form Sleep-Related Impairment 8a.
Risk of Thyroid C-Cell Tumors
Inform patients that ZEPBOUND causes thyroid C-cell tumors in rats and that the human relevance of this finding has not been determined. Counsel patients to report symptoms of thyroid tumors (e.g., a lump in the neck, persistent hoarseness, dysphagia, or dyspnea) to their healthcare provider [see Boxed Warning and Warnings and Precautions (5.1)].
Severe Gastrointestinal Adverse Reactions
Inform patients of the potential risk of severe gastrointestinal adverse reactions. Instruct patients to contact their healthcare provider if they have severe or persistent gastrointestinal symptoms [see Warnings and Precautions (5.2)].
Acute Kidney Injury Due to Volume Depletion
Inform patients of the potential risk of acute kidney injury due to dehydration associated with gastrointestinal adverse reactions. Advise patients to take precautions to avoid fluid depletion. Inform patients of the signs and symptoms of acute kidney injury and instruct them to promptly report any of these signs or symptoms or persistent (or extended) nausea, vomiting, and diarrhea to their healthcare provider [see Warnings and Precautions (5.3)].
Acute Gallbladder Disease
Inform patients of the risk of acute gallbladder disease. Instruct patients to contact their healthcare provider for appropriate clinical follow-up if gallbladder disease is suspected [see Warnings and Precautions (5.4)].
Acute Pancreatitis
Inform patients of the potential risk for acute pancreatitis and its symptoms: severe abdominal pain that may radiate to the back, and which may or may not be accompanied by nausea or vomiting. Instruct patients to discontinue ZEPBOUND promptly and contact their healthcare provider if pancreatitis is suspected [see Warnings and Precautions (5.5)].
Hypersensitivity Reactions
Inform patients that serious hypersensitivity reactions have been reported with use of tirzepatide. Advise patients on the symptoms of hypersensitivity reactions and instruct them to stop taking ZEPBOUND and seek medical advice promptly if such symptoms occur [see Warnings and Precautions (5.6)].
Hypoglycemia
Inform patients of the risk of hypoglycemia and educate patients on the signs and symptoms of hypoglycemia. Advise patients on insulin or insulin secretagogue therapy that they may have an increased risk of hypoglycemia when using ZEPBOUND and to report signs and/or symptoms of hypoglycemia to their healthcare provider [see Warnings and Precautions (5.7)].
Diabetic Retinopathy Complications in Patients with Type 2 Diabetes Mellitus
Inform patients with type 2 diabetes mellitus to contact their healthcare provider if changes in vision are experienced during treatment with ZEPBOUND [see Warnings and Precautions (5.8)].
Pulmonary Aspiration During General Anesthesia or Deep Sedation
Inform patients that ZEPBOUND may cause their stomach to empty more slowly which may lead to complications with anesthesia or deep sedation during planned surgeries or procedures. Instruct patients to inform healthcare providers prior to any planned surgeries or procedures if they are taking ZEPBOUND [see Warnings and Precautions (5.9)].
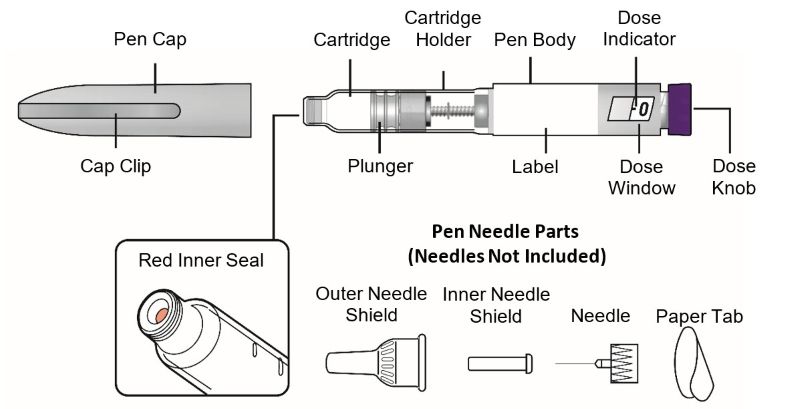
Never Share a ZEPBOUND KwikPen Between Patients
Advise patients that they must never share a ZEPBOUND KwikPen with another person, even if the pen needle is changed, because doing so carries a risk for transmission of blood-borne pathogens [see Warnings and Precautions (5.10)].
Pregnancy
Advise a pregnant patient of the potential risk to a fetus. Advise patients to inform their healthcare provider if they are pregnant or intend to become pregnant during treatment with ZEPBOUND. Advise patients that there is a pregnancy exposure registry that monitors pregnancy outcomes in women exposed to ZEPBOUND during pregnancy [see Use in Specific Populations (8.1)].
Contraception
Use of ZEPBOUND may reduce the efficacy of oral hormonal contraceptives. Advise patients using oral hormonal contraceptives to switch to a non-oral contraceptive method, or add a barrier method of contraception for 4 weeks after initiation with ZEPBOUND and for 4 weeks after each dose escalation [see Drug Interactions (7.2), Use in Specific Populations (8.3), and Clinical Pharmacology (12.3)].
Administration
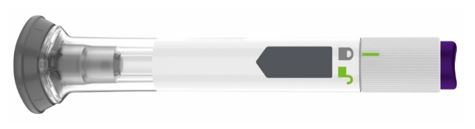
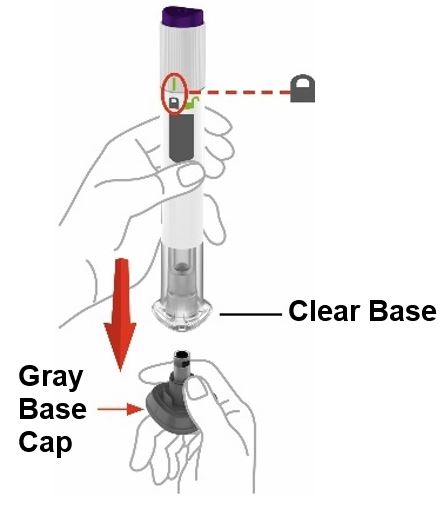
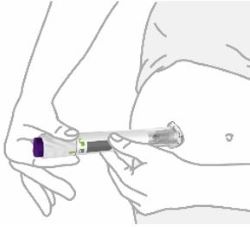
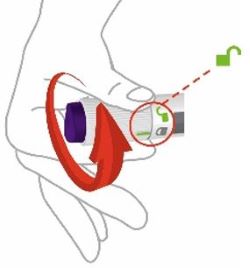
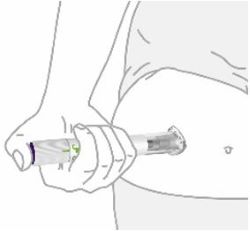
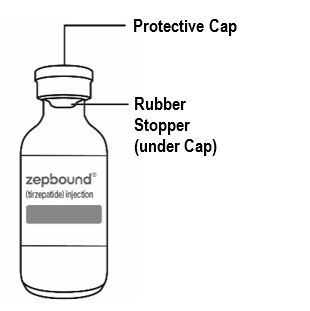
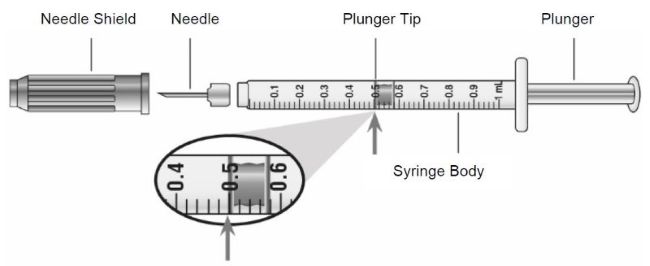
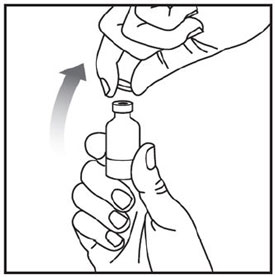
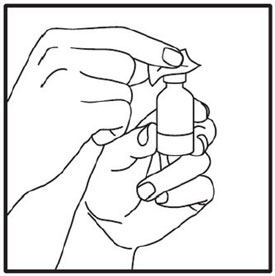
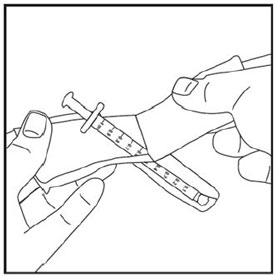
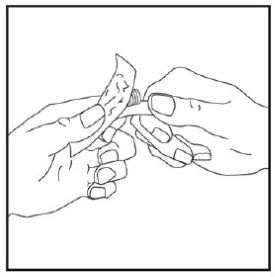
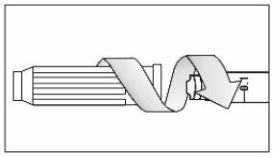
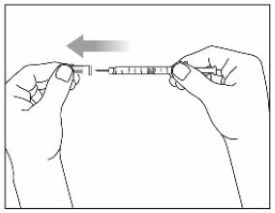
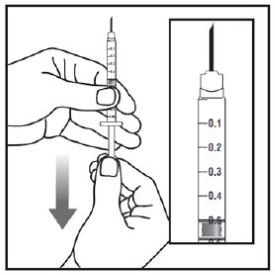
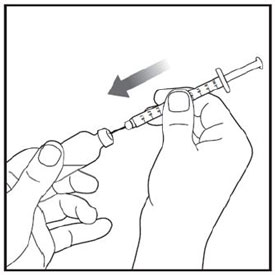
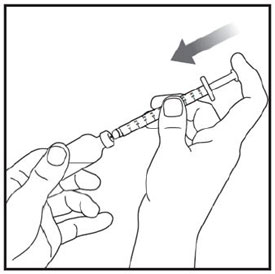
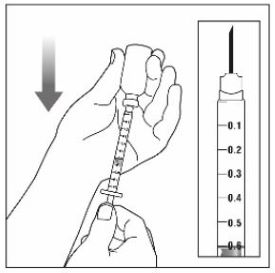
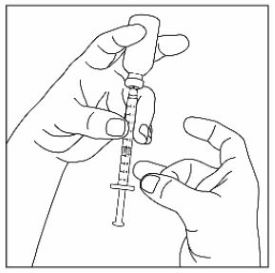
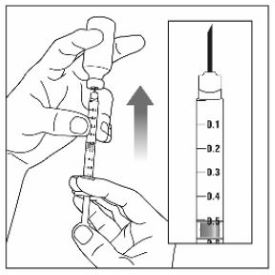
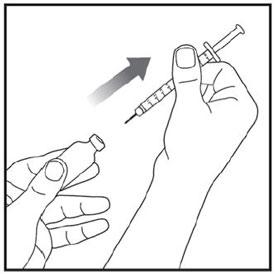
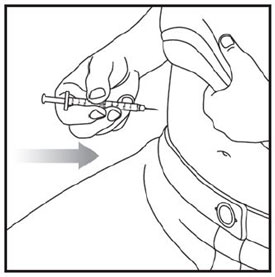
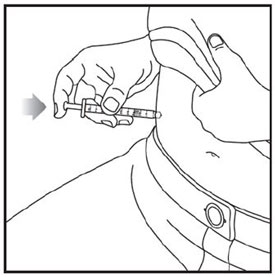
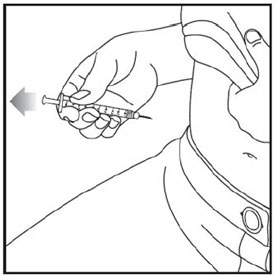
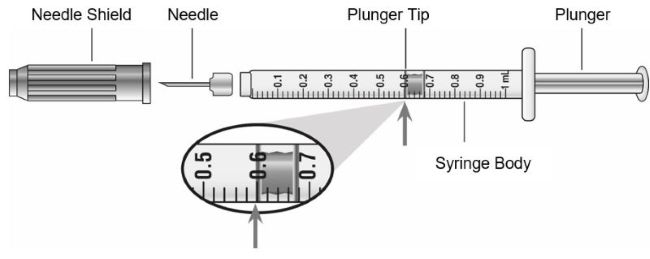
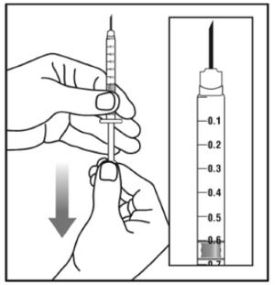
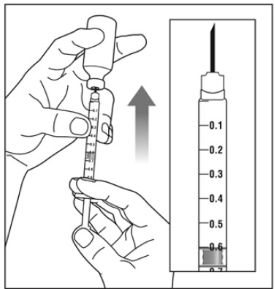
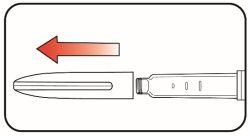
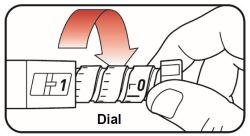
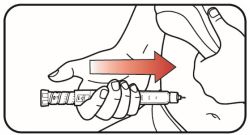
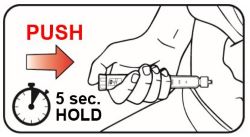
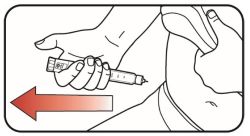
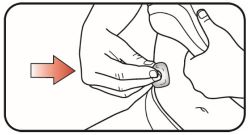
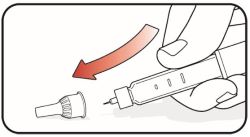
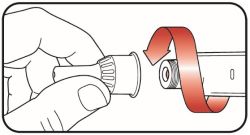
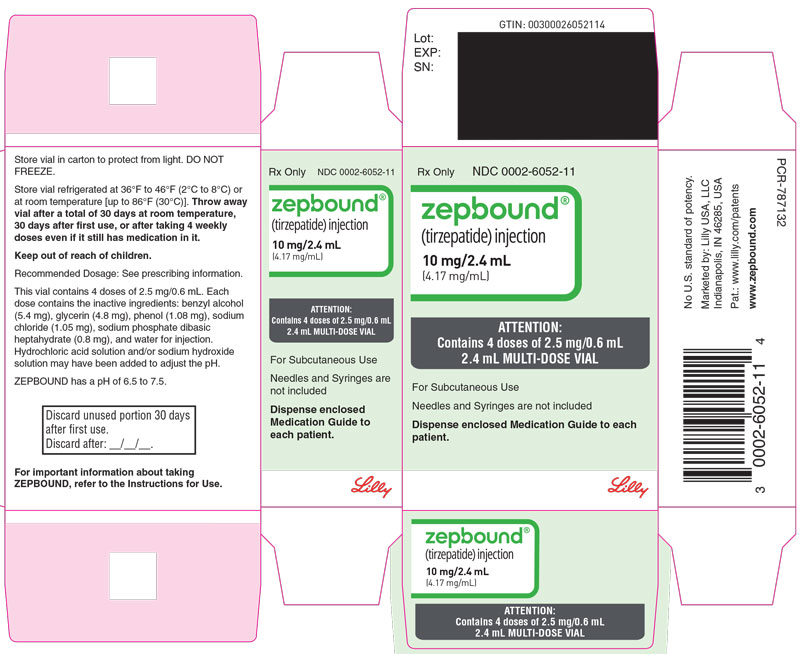
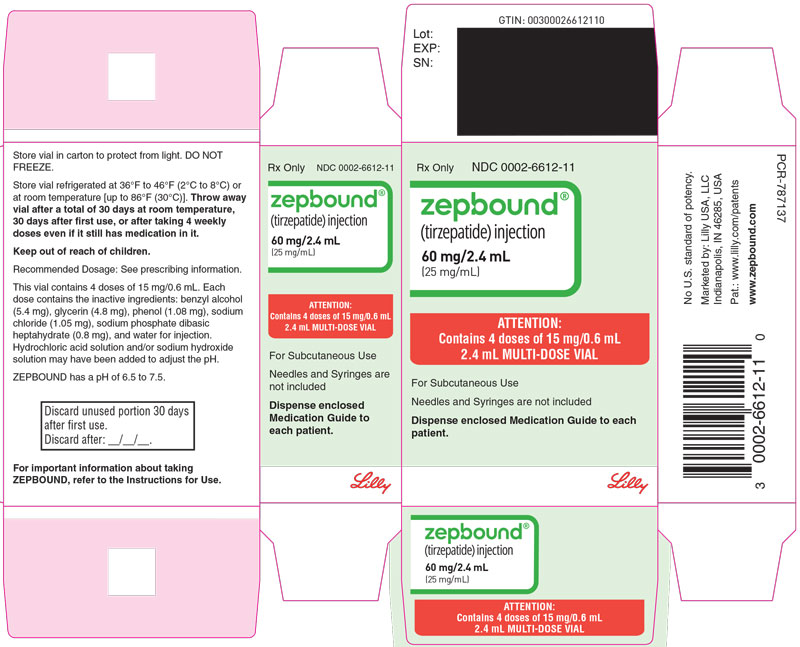
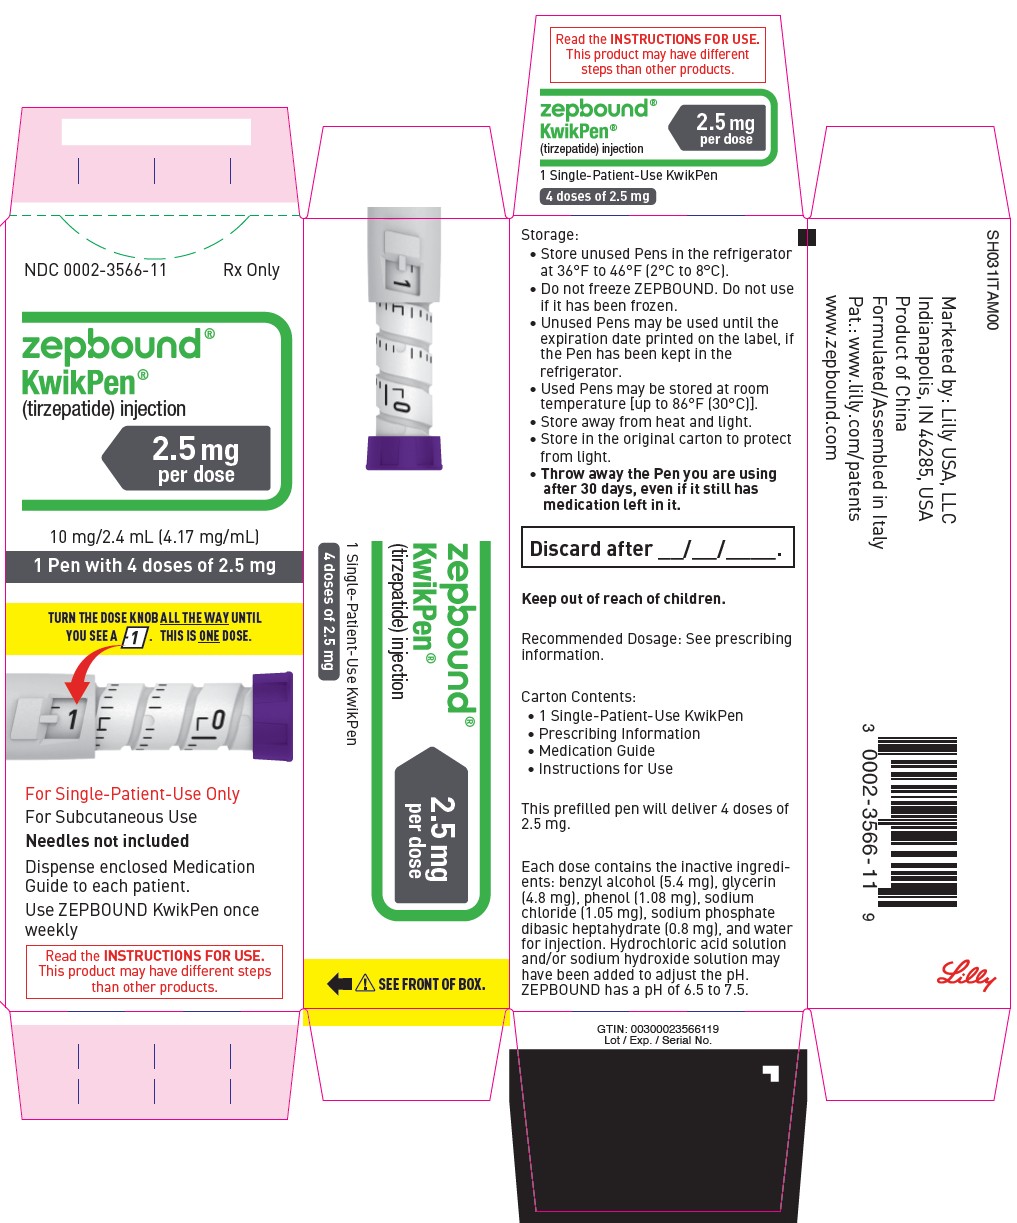
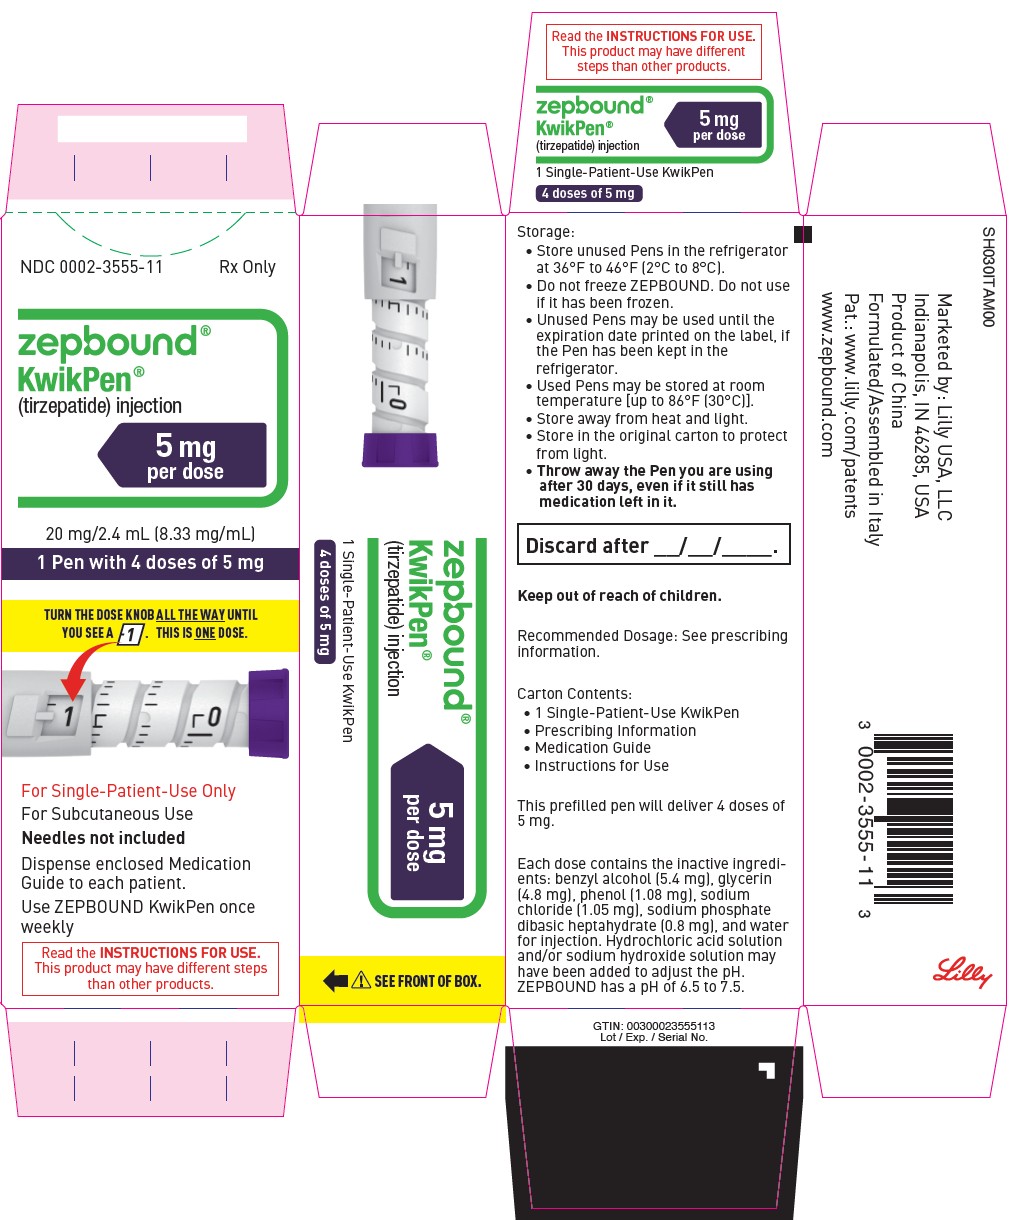
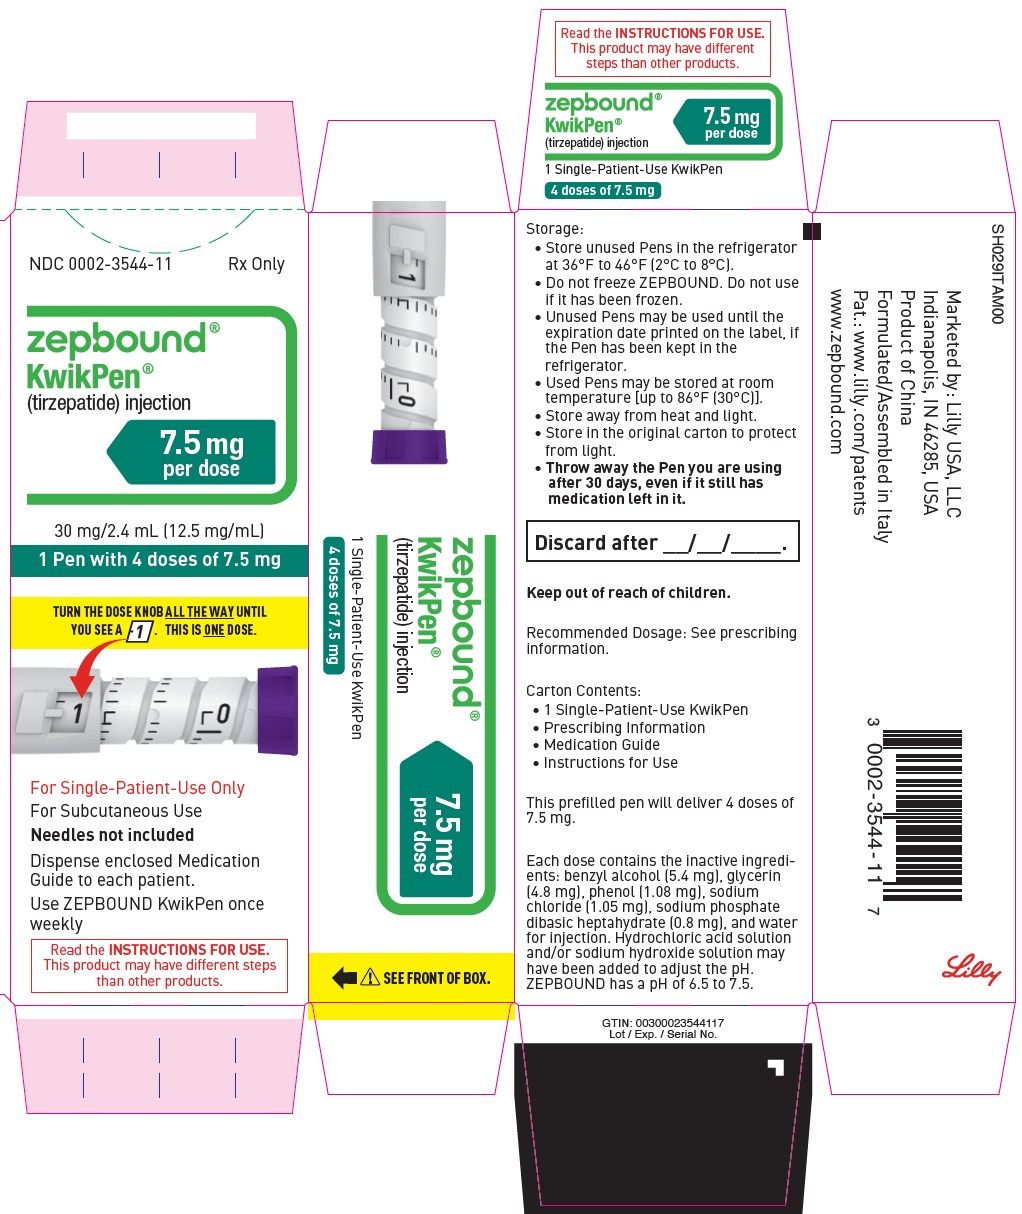
Instruct patients how to prepare and administer the correct dose of ZEPBOUND and assess their ability to inject subcutaneously to ensure the proper administration of ZEPBOUND. Inform patients and their caregiver(s) which ZEPBOUND presentation (e.g., vial, prefilled single-dose pen, single-patient-use KwikPen) they will receive and ensure they receive training appropriate for that specific presentation. If the prescribed ZEPBOUND presentation changes, ensure patients and caregivers receive appropriate training and instruct them to consult the Instructions for Use for the newly prescribed presentation. Advise caregivers that ZEPBOUND KwikPen is not recommended for self-administration by those with visual impairment unless their healthcare provider determines the patient can properly administer. Instruct patients using ZEPBOUND vials to always use a new syringe and needle for each injection and to use a syringe appropriate for dose administration (e.g., a 1 mL syringe capable of measuring a 0.5 mL or 0.6 mL dose) [see Dosage and Administration (2.4)].
Missed Doses
Inform patients if a dose is missed, it should be administered as soon as possible within 4 days after the missed dose. If more than 4 days have passed, the missed dose should be skipped and the next dose should be administered on the regularly scheduled day. In each case, inform patients to resume their regular once weekly dosing schedule [see Dosage and Administration (2.3)].
Marketed by: Lilly USA, LLC, Indianapolis, IN 46285, USA
Copyright © 2023, 2026, Eli Lilly and Company. All rights reserved.
Pat.: www.lilly.com/patents
ZEP-0016-USPI-20260828