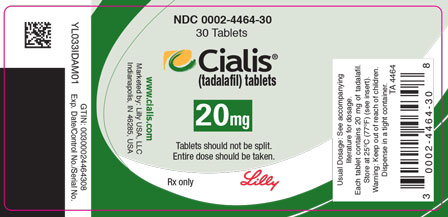
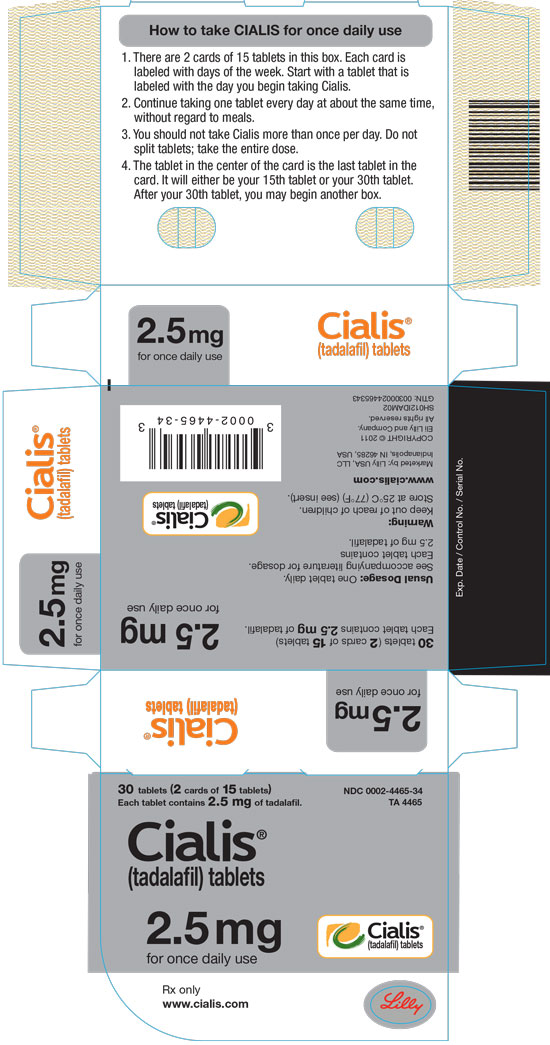
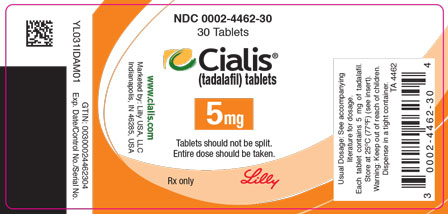
Cialis Tablet, Film Coated
Product Images NDC 0002-4464
View Photos of Packaging, Regulatory Labels, and Product Appearance
Product Visual Gallery
This gallery contains 13 technical images submitted to the FDA as part of the official labeling for Cialis (NDC 0002-4464). Unlike standard consumer photos, these assets often include clinical data figures, molecular chemical structures, and official manufacturer packaging layouts.
As provided by Eli Lilly And Company, these visuals offer a comprehensive scientific overview of the product's physical and chemical identity, aiding pharmacists and researchers in product verification and study.
Product Images & Figures Index
Cialis 20mg 30ct 033 01
Cialis 2point5mg Cart 012 02
This text is a set of instructions for taking Cialis tablets, a medication containing tadalafil. The box contains two cards of 15 tablets each labeled with the days of the week. The patient should start with a tablet labeled with the day they begin taking Cialis and then continue taking one tablet each day at around the same time, with or without meals. The tablet in the center of the card is the last one and will be the 15th or 30th tablet. Patients should not take more than one tablet per day and should take the whole dose without splitting the tablets. The text includes a product code and a trademark symbol for Cialis.*
Cialis 5mg 30ct 031 01
Chemical Structure (Cialis Uspi F001 Structure V1)
Figure (Cialis Uspi F001 V2)
This is a graph that shows the concentration of Tadalafil (measured in micrograms per liter) in plasma over time (measured in hours) for different dosages and administration schedules. A single dose of 20mg Tadalafil is represented by a solid line, while a single dose of 5mg is represented by a dashed line with letter "a" and a once-daily 5mg dose after 5 consecutive days of administration is represented by a dashed line with letter "e." The y-axis represents Tadalafil concentration, while the x-axis represents time in hours. There is no other available information.*
Figure (Cialis Uspi F002 V1)
This appears to be a chart or table showing the difference in blood pressure (measured in millimeters of mercury) between a group taking tadalafil and a group taking a placebo, for both standing and supine positions. However, without more context it is difficult to provide a more detailed description or explanation of the data.*
Figure (Cialis Uspi F003 V1)
The text appears to be a mixture of numerical values, symbols, and some errors. A graph is also indicated with values plotted on the x and y-axes. However, it is not clear what kind of data or relationships are represented by the graph due to errors in the input text. Therefore, a useful description cannot be generated.*
Figure (Cialis Uspi F004 V1)
Figure 5 (Cialis Uspi F005 V1)
This is a graph showing the change from baseline in IPSS total score over the duration of treatment in weeks. There are two lines on the graph, one for the CIAUSSmg treatment and one for the placebo treatment. In the CIAUSSmg treatment group, there is a significant decrease in IPSS total score compared to baseline, indicated by a p-value of less than 0.01. The graph shows that the greatest improvement in IPSS total score occurs at around 5 to 6 weeks of treatment.*
Figure 6 (Cialis Uspi F006 V1)
The text provides information about the "Change from Baseline in IPSS Total Score" during the "Duration of Treatment (weeks)." The data appears to be related to the effectiveness of CIALIS 5mg versus a placebo, as denoted by the symbols next to the drug names. However, without more information or context, it is difficult to provide a more specific description.*
Figure 7 (Cialis Uspi F007 V2)
Figure 8 (Cialis Uspi F008 V1)
This text provides information about the change in IPSS total score during a 12-week treatment. This change was compared between a group treated with CIAUS 5 mg and a group treated with placebo. The results indicate a statistically significant improvement (p<0.01) in the IPSS total score for the CIAUS 5 mg group compared to the placebo group.*
* These product label images have been analyzed using experimental machine learning. Please verify findings with the primary label text.