Mounjaro Injection, Solution
Product Images NDC 0002-4523
View Photos of Packaging, Regulatory Labels, and Product Appearance
Product Visual Gallery
This gallery contains 22 technical images submitted to the FDA as part of the official labeling for Mounjaro (NDC 0002-4523). Unlike standard consumer photos, these assets often include clinical data figures, molecular chemical structures, and official manufacturer packaging layouts.
As provided by Eli Lilly And Company, these visuals offer a comprehensive scientific overview of the product's physical and chemical identity, aiding pharmacists and researchers in product verification and study.
Product Images & Figures Index
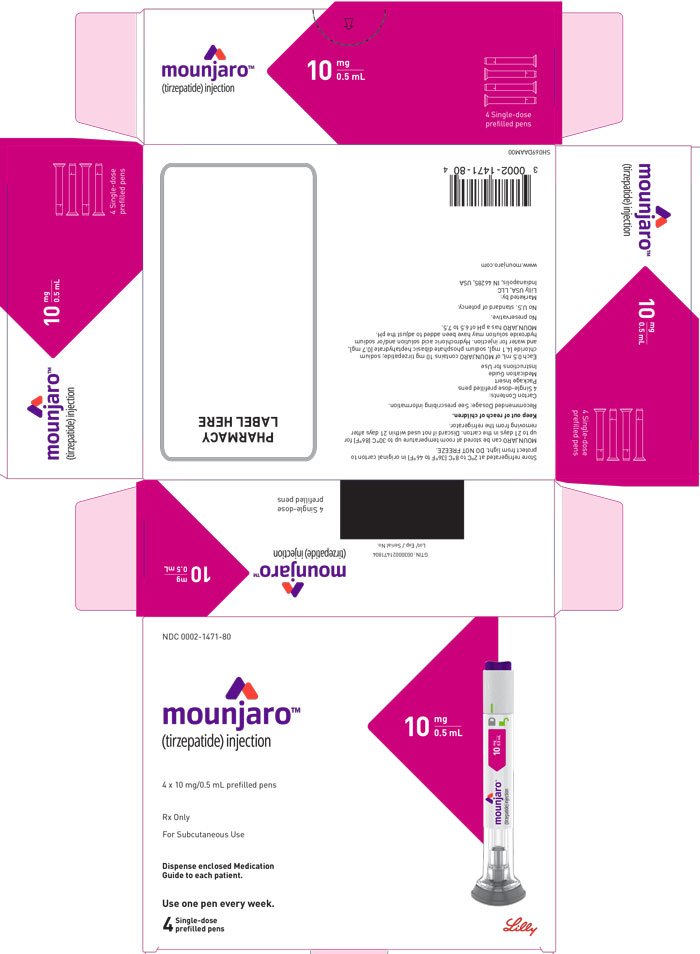
Package Label (Mounjaro™, 10 mg/0.5 mL, Carton, 4 Single-Dose Pens)
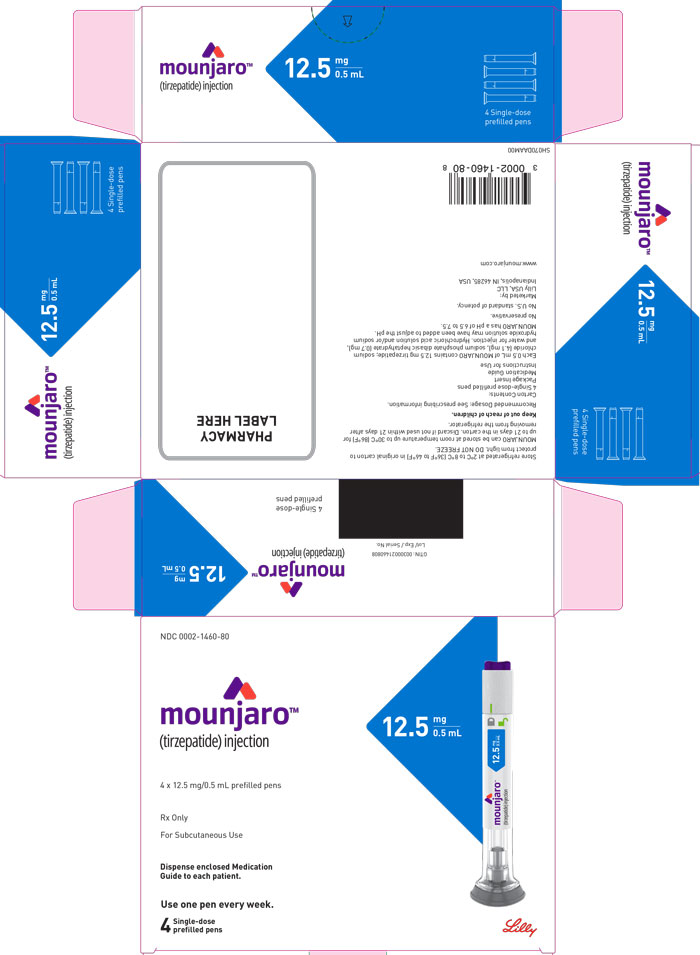
Package Label (Mounjaro™, 12.5 mg/0.5 mL, Carton, 4 Single-Dose Pens)
Mounjaro is a medication that is administered through injection once a week. The name and dosage of the medication are legible, but no other information is available.*
Package Label (Mounjaro™, 15 mg/0.5 mL, Carton, 4 Single-Dose Pens)
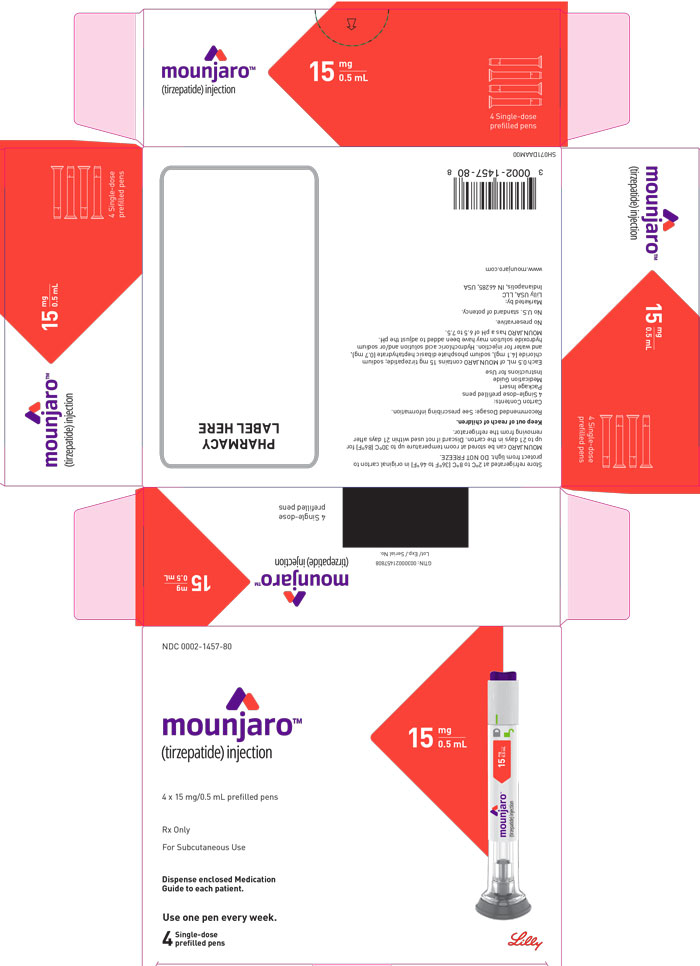
This is a description not-available. The text provided is a mixture of random words, numbers, and symbols with no clear meaning or context.*
Package Label (Mounjaro™, 2.5 mg/0.5 mL, Carton, 4 Single-Dose Pens)
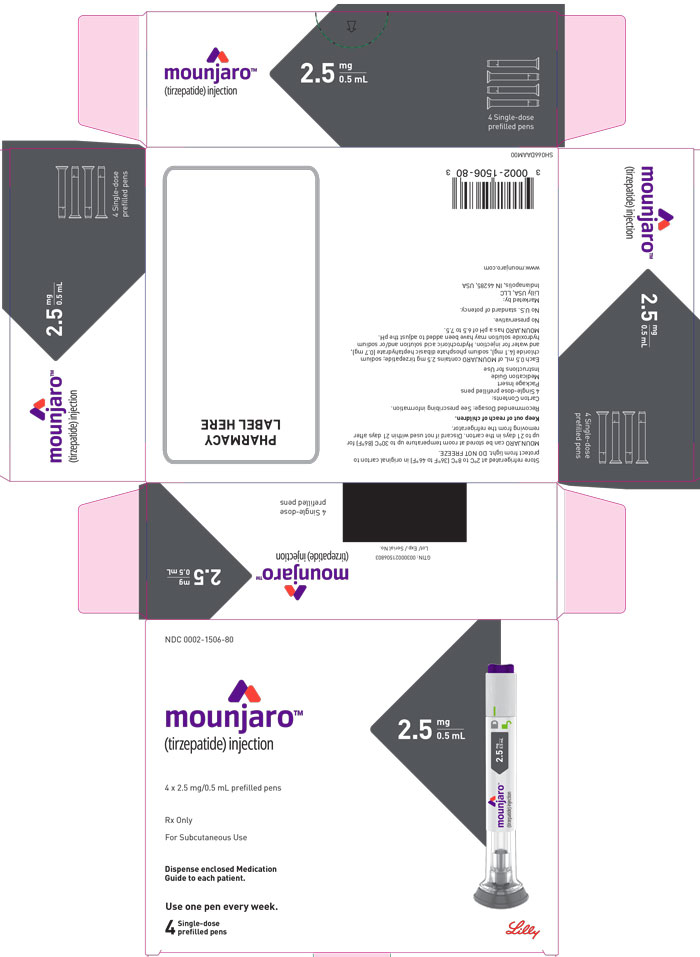
"Mounjaro (Tirzepatide) Injection" is a medication used for treatment purposes. The text also contains some numbers and code that may be related to the medication's packaging and identification.*
Package Label (Mounjaro™, 5 mg/0.5 mL, Carton, 4 Single-Dose Pens)
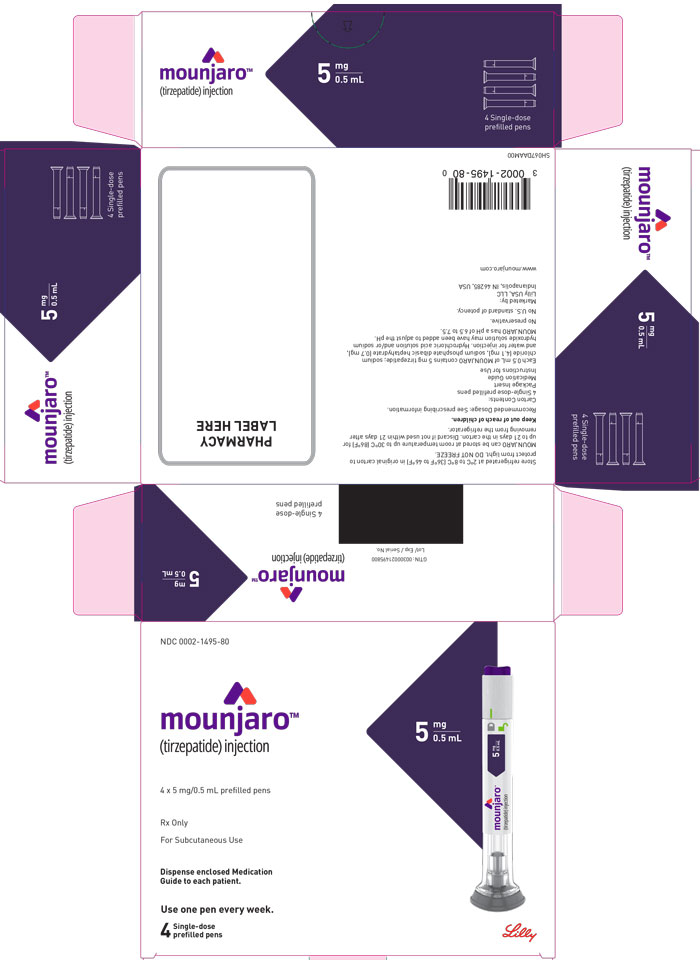
This is not a readable text.*
Package Label (Mounjaro™, 7.5 mg/0.5 mL, Carton, 4 Single-Dose Pens)
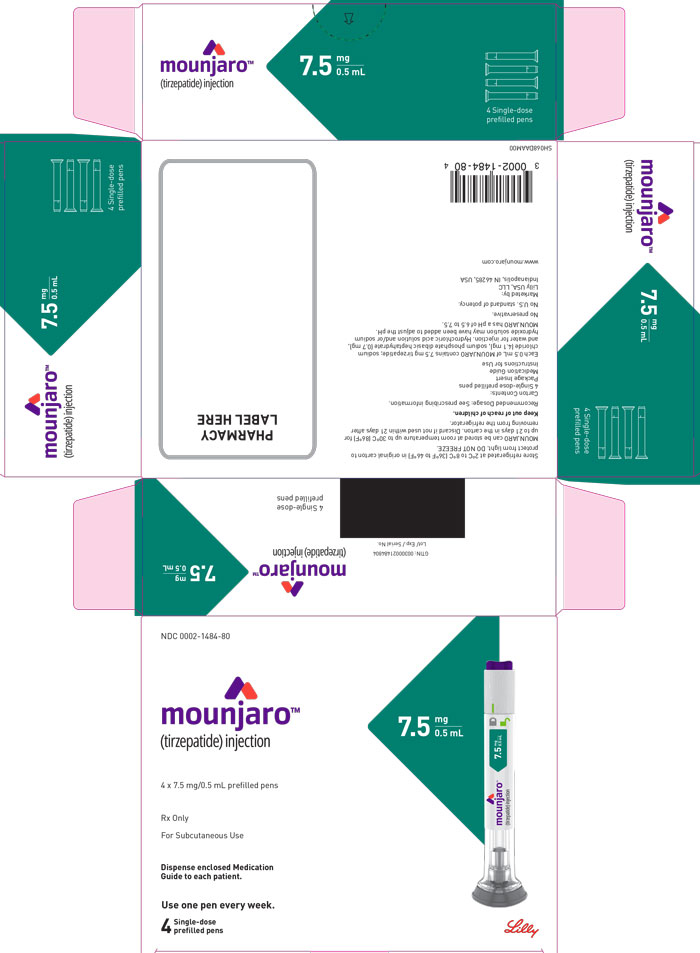
This text appears to be the package insert or instructions for the medication called "Mounjaro". It is administered through injection with a pen once a week. There are some unclear characters and symbols throughout the text, but the medication name and usage instructions are clear.*
Figure (Moun Ifu 1 V1)

Figure (Moun Ifu 10 V1)
Figure (Moun Ifu 2 V1)
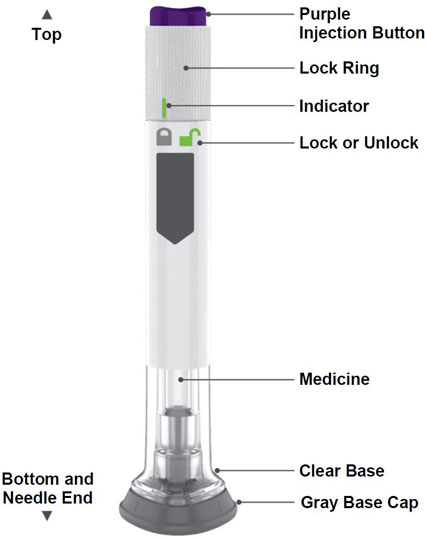
The text seems to be describing a device used for medication injection. The color of the device appears to be purple and gray. There is a lock ring, a top injection button, and an indicator to show whether the device is locked or unlocked. The bottom features a clear base and a gray base cap, and there is a needle end. However, without further context, it is unclear what specific type of medication the device is designed for or any other details.*
Figure (Moun Ifu 3 V1)
Figure (Moun Ifu 4a V1)
Figure (Moun Ifu 4b V1)

Figure (Moun Ifu 5 V1)
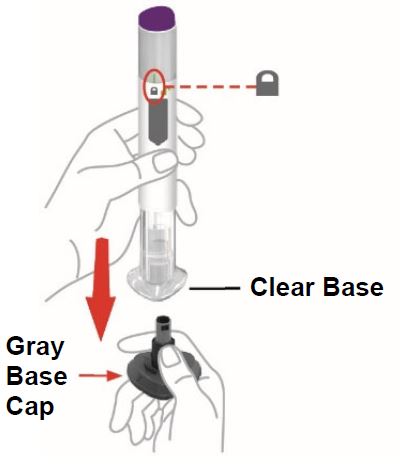
Figure (Moun Ifu 6 V1)
Figure (Moun Ifu 7 V1)
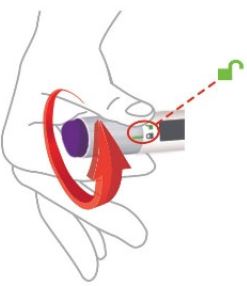
Figure (Moun Ifu 8 V1)
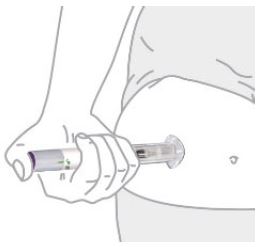
Figure (Moun Ifu 9 V1)
Figure (Moun Qr)

Structural Formula (Moun Uspi Chem Struc)
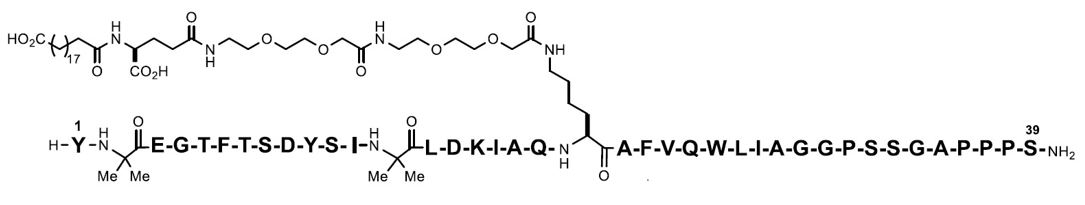
Figure 1 (Moun Uspi F1 V1)
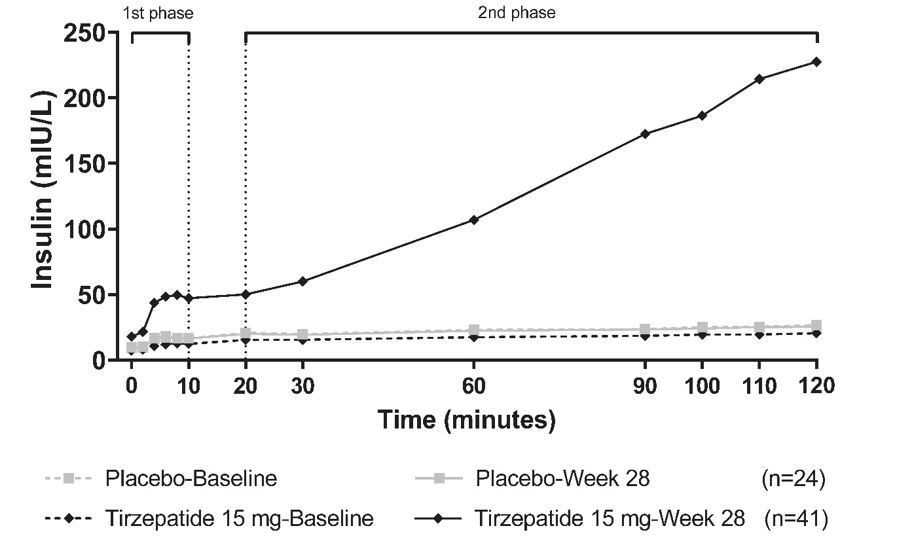
This text appears to be a table containing information related to insulin levels and time intervals for a study or research. The first phase shows four intervals of 0, 10, 20, and 30 minutes and compares the insulin levels between Placebo-Baseline and Tirzepatide 15 mg-Baseline. The second phase shows time intervals of 60, 90, 100, 110, and 120 minutes, and compares the insulin levels between Placebo-Week 28 (with a sample size of 24) and Tirzepatide 15 mg-Week 28 (with a sample size of 41).*
Figure 2 (Moun Uspi F2 V1)
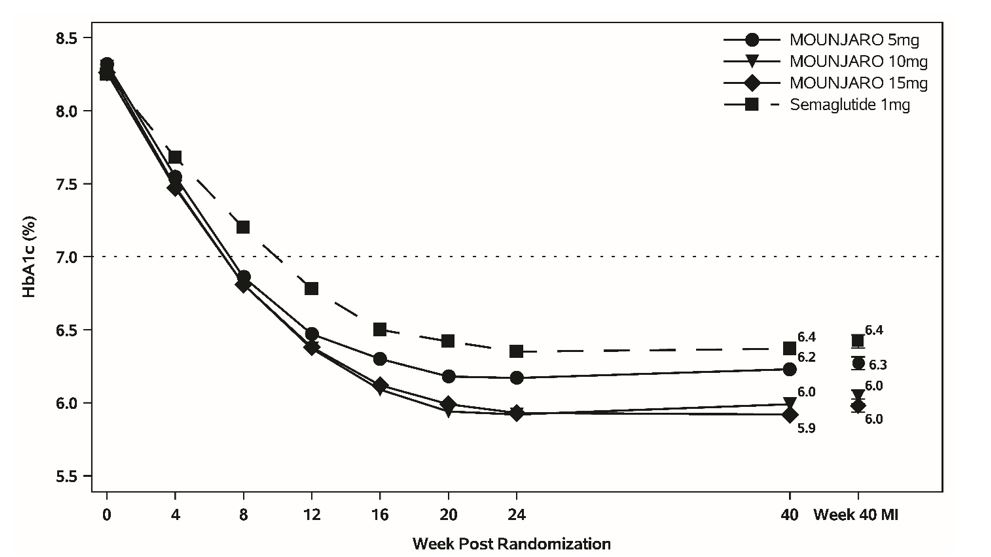
This appears to be a table with values corresponding to different medications and dosages. The column header indicates "HbA1C (%)." The first column lists different medications (MOUNJARO and Semaglutide) and their varying dosages. The only value within the table is "8.0" and it's unclear what this represents. The remaining text includes "554", "T", "40", "Week 40", and "Post Randomization" but does not provide enough context to derive a useful description.*
* These product label images have been analyzed using experimental machine learning. Please verify findings with the primary label text.