Product Images Alimta

View Photos of Packaging, Labels & Appearance

Product Label Images

The following 12 images provide visual information about the product associated with Alimta NDC 0002-7623 by Eli Lilly And Company, such as packaging, labeling, and the appearance of the drug itself. This resource could be helpful for medical professionals, pharmacists, and patients seeking to verify medication information and ensure they have the correct product.

alimta 100mg 011 03

alimta 100mg 011 03

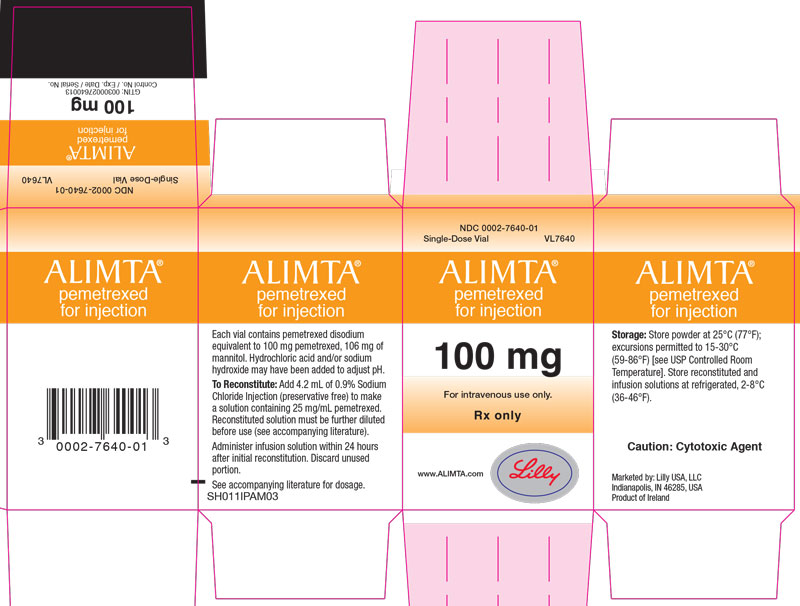
This is a description of a medication called Pemetrex, which is available in injection form. It is equivalent to 100 mg of pemetrexed, 0.6 mg of mannitol, hydrochloric acid, and sodium. The medication should be added to a suitable temperature and reconstituted before use. The text also provides instructions for reconstitution and administration of the medication. Caution needs to be taken while handling the drug as it is cytotoxic. The accompanying information needs to be referred to for usage purpose.*

alimta 500mg 010 03

alimta 500mg 010 03

This appears to be a product literature for the drug "Pemetrexed" used for injection for medical purposes. It provides instructions on how to prepare for injection and possible storage for the drug. The text contains a cautionary warning indicating that the drug is cytotoxic and was likely produced by Ly USA LG.*

Structural Formula - alimta f01 v01

Structural Formula - alimta f01 v01

Figure 1 - alimta f05 v04

Figure 1 - alimta f05 v04

This appears to be a table displaying data on two chemotherapy treatment options for cancer, AUMTA + Cisplatin (AC) and Gemcitabine + Cisplatin (GC), along with information on survival probability, survival time in months, and the number of patients at risk for each treatment. It is not possible to determine what specifically the numbers represent without more context.*

Figure 2 - alimta f08 v3

Figure 2 - alimta f08 v3

Figure 4 - alimta f12 v3

Figure 4 - alimta f12 v3

This appears to be a data chart describing survival probabilities and times for ALIMTA (a medication) and Placebo (a control group) over a period of months. The numbers correspond to the count of patients, and percentage of those who survived or died, along with the time span.*

Figure 5 - alimta f13 v2

Figure 5 - alimta f13 v2

This appears to be a table showing survival probability and patients at risk for a clinical trial involving ALIMTA and a placebo treatment. The data includes the number of patients in each group, survival times in months, and potentially some errors or missing values. However, the formatting is unclear and some of the characters are unreadable, so further interpretation may be difficult.*

Figure 7 - alimta f14 v2

Figure 7 - alimta f14 v2

This appears to be a survival analysis table that includes the number of patients who received ALIMTA and a placebo treatment, their survival time in months, and the number of patients at risk at each time point. However, the table is not complete and some values are missing or unreadable, making the description of the analysis difficult.*

Figure 3 - alimta f15 v01

Figure 3 - alimta f15 v01

This appears to be a table of data with information on two different treatment options for patients, referred to as "ALIMTA+Gisplatin (AC)" and "Gemeitabine+Cisplatin (GC)." There are numbers listed under the "Survival Time" column, which suggests that this table is measuring how long patients in each group survived. There are also numbers listed under "Patients at Risk" for each group, which may refer to the number of patients who were still in the trial at different time points. Without additional context, it is difficult to draw any specific conclusions from this data.*

Figure 6 - alimta f16 v1

Figure 6 - alimta f16 v1

This is a table displaying data related to survival probability, patients at risk, and survival time for patients receiving treatment with ALIMTA and Dlacite. The table shows the number of patients at risk, survival time in months, and survival probability percentages. The table also includes codes such as "pos" and "w2 2," which may need further context to understand their meaning.*

Figure 8 - alimta f17 v1

Figure 8 - alimta f17 v1

This text is a comparison of survival time between patients treated with ALIMTA+ Cisplatin and those without. The graph shows the number of patients at risk in each group at different time intervals, measured in months. The text includes some chemical components, such as Cisplatin.*

alimta f18 v1

alimta f18 v1

This is a graph that shows the overall survival percentage at different time intervals, ranging from 0 to 21 months, for two treatment arms: A+P+C, which stands for ALIMTA + pembrolizumab + platinum chemotherapy, and A+C, which stands for ALIMTA + platinum chemotherapy + placebo. The number of individuals at risk is given for each time interval.*

* The product label images have been analyzed using a combination of traditional computing and machine learning techniques. It should be noted that the descriptions provided may not be entirely accurate as they are experimental in nature. Use the information in this page at your own discretion and risk.