Yervoy Injection
Product Images NDC 0003-2327

13 FDA label images from E.r. Squibb & Sons, L.l.c. · Packaging, Regulatory Labels, and Product Appearance

Product Visual Gallery

This gallery contains 13 technical images submitted to the FDA as part of the official labeling for Yervoy (NDC 0003-2327). Unlike standard consumer photos, these assets often include clinical data figures, molecular chemical structures, and official manufacturer packaging layouts.

As provided by E.r. Squibb & Sons, L.l.c., these visuals offer a comprehensive scientific overview of the product's physical and chemical identity, aiding pharmacists and researchers in product verification and study.

FDA Label Image

Yervoy 200mg Carton Serialized
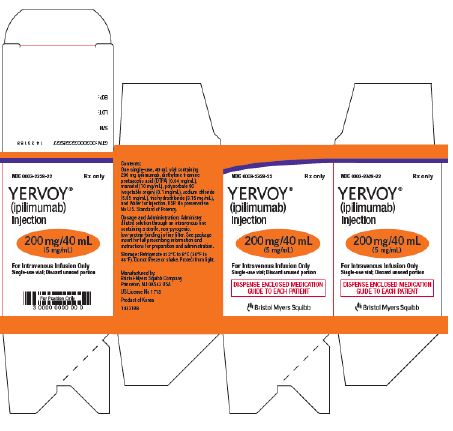
Yervoy 200mg Carton Serialized
YERVOY (ipilimumab) Injection 200 mg/40 mL (5 mg/mL) intravenous injection label by E.R. Squibb & Sons, L.L.C. The label includes dosage information, usage instructions, and warnings. It states the product is for intravenous infusion only, single-use vial, and includes a note to dispense the enclosed medication guide to each patient. The manufacturer is Bristol Myers Squibb.*
FDA Label Image

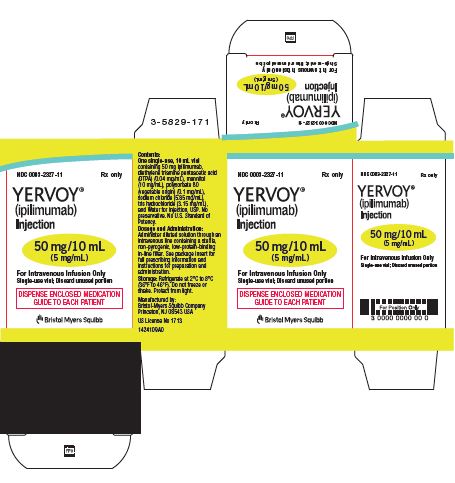
Yervoy 50mg Carton Serialized

Yervoy 50mg Carton Serialized
Carton packaging label for YERVOY (ipilimumab) injection, 50 mg/10 mL (5 mg/mL) for intravenous infusion only. The label shows key details including the proprietary and generic names, dosage strength, single-use vial instruction, and a highlighted warning to dispense the enclosed medication guide. The labeler is Bristol Myers Squibb, and it includes NDC codes and regulatory information.*
FDA Label Image

Yervoy Os Ca184 029

Yervoy Os Ca184 029
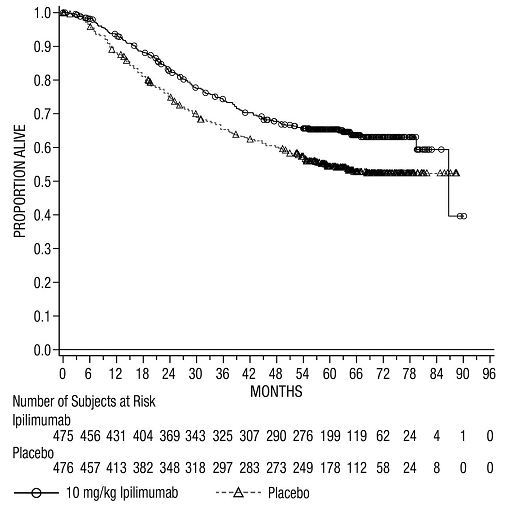
A survival curve chart displaying proportion alive over time in months comparing 10 mg/kg Ipilimumab treatment to placebo. The x-axis is labeled 'Months,' from 0 to 96, and the y-axis is labeled 'Proportion Alive,' from 0.0 to 1.0. The graph includes a table below showing the number of subjects at risk at various time points for both Ipilimumab and placebo groups, with symbols identifying each treatment group on the graph.*
FDA Label Image

Yervoy Os Checkmate 067

Yervoy Os Checkmate 067
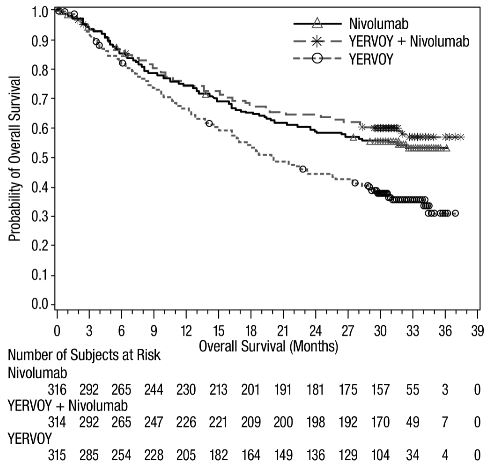
A Kaplan-Meier survival curve chart depicting overall survival probability over months for three treatment groups: Nivolumab, YERVOY, and the combination of YERVOY + Nivolumab. The x-axis shows overall survival in months up to approximately 39, and the y-axis shows the probability of overall survival from 0 to 1. The chart also includes the number of subjects at risk at intervals for each group below the x-axis.*
FDA Label Image

Yervoy Os Checkmate 214

Yervoy Os Checkmate 214
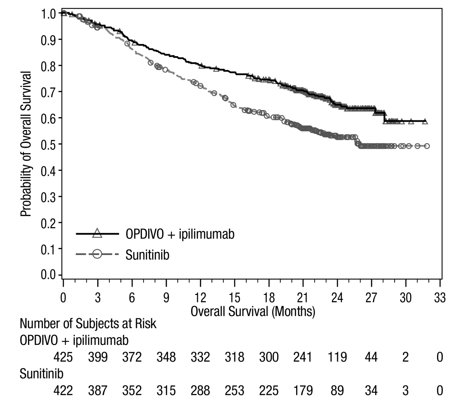
A Kaplan-Meier survival curve chart comparing the probability of overall survival over time (months) between two groups: one treated with OPDIVO plus ipilimumab and the other with Sunitinib. The chart includes a risk table showing the number of subjects at risk at various time points for each treatment group.*
FDA Label Image

Yervoy Os Checkmate 227

Yervoy Os Checkmate 227
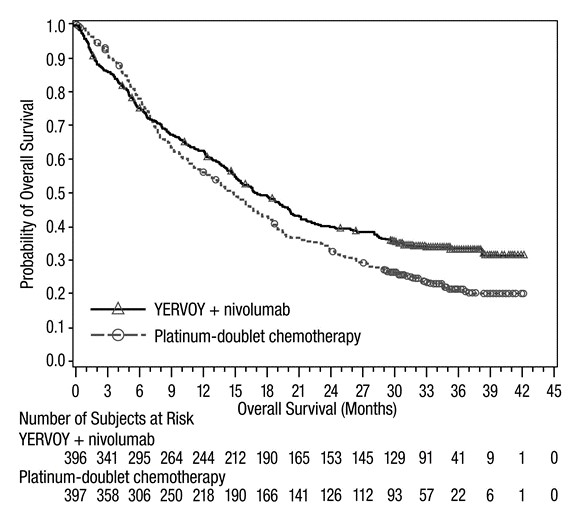
A Kaplan-Meier survival curve chart comparing overall survival probability over months between YERVOY + nivolumab and platinum-doublet chemotherapy. The x-axis shows overall survival in months (0 to 45), and the y-axis shows the probability of overall survival (0 to 1.0). Numerical risk data for subjects at risk over time is displayed below the chart for both treatment groups.*
FDA Label Image

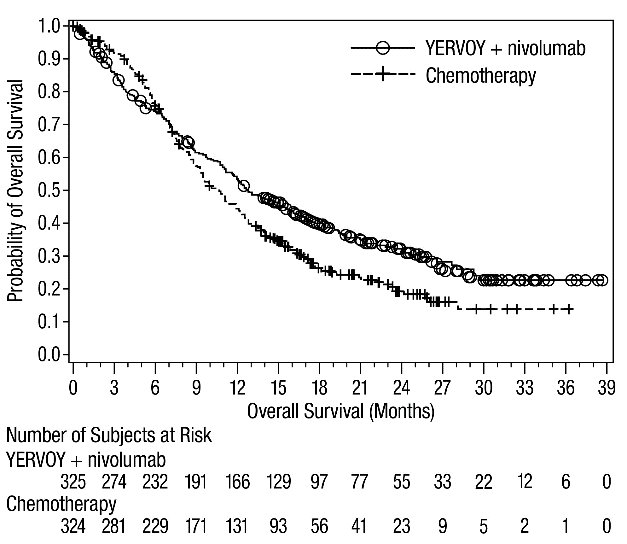
Yervoy Os Checkmate 648 A

Yervoy Os Checkmate 648 A
A Kaplan-Meier survival curve comparing overall survival probability over time (months) between two treatment groups: YERVOY + nivolumab and Chemotherapy. The graph includes a table showing the number of subjects at risk at various time points for each group, indicating a longer survival trend with YERVOY + nivolumab.*
FDA Label Image

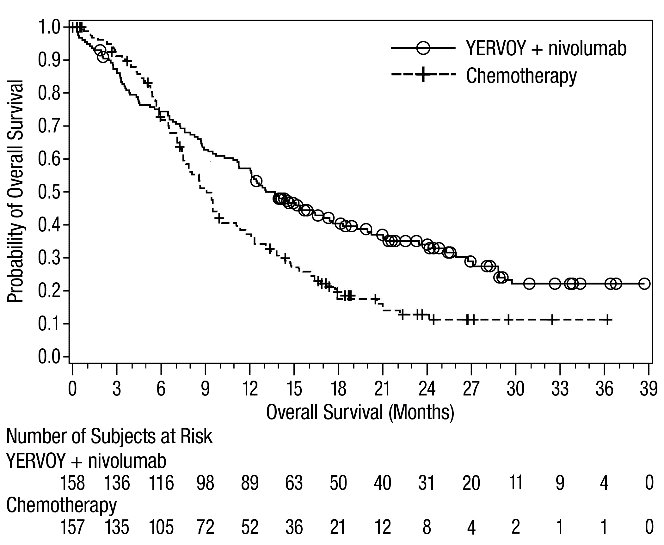
Yervoy Os Checkmate 648 B

Yervoy Os Checkmate 648 B
Kaplan-Meier survival curve comparing overall survival probabilities over time in months between YERVOY (ipilimumab) plus nivolumab versus chemotherapy. The chart includes the number of subjects at risk for each treatment group at various time points up to 39 months.*
FDA Label Image

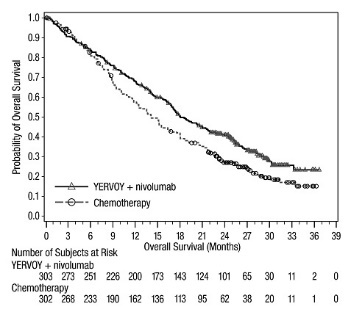
Yervoy Os Checkmate 743

Yervoy Os Checkmate 743
A Kaplan-Meier survival curve chart comparing the probability of overall survival over months between two treatment groups: YERVOY (ipilimumab) combined with nivolumab, and chemotherapy. The x-axis represents overall survival in months, and the y-axis shows the probability of overall survival. A table below the graph displays the number of subjects at risk for each group at various time points.*
FDA Label Image

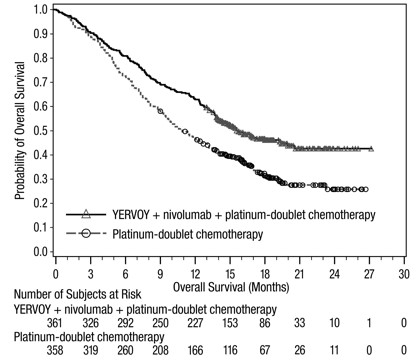
Yervoy Os Checkmate 9la

Yervoy Os Checkmate 9la
A Kaplan-Meier survival curve chart comparing overall survival probability over 30 months for two treatment groups: YERVOY (ipilimumab) with nivolumab plus platinum-doublet chemotherapy, and platinum-doublet chemotherapy alone. The x-axis represents overall survival in months, and the y-axis shows the probability of overall survival. Numbers of subjects at risk are listed below the x-axis for both groups.*
FDA Label Image

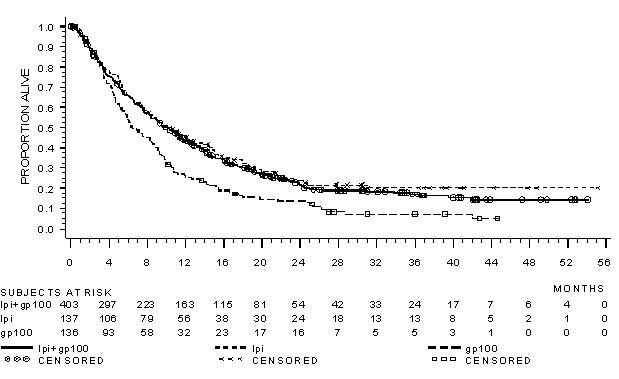
Yervoy Os Mdx010 20

Yervoy Os Mdx010 20
A survival curve chart showing the proportion of subjects alive over a timeline spanning months from 0 to 56. The chart compares survival outcomes for three groups labeled ip+gp100, Ipi, and gp100, with data points and censored subjects indicated. A table below displays the number of subjects at risk in each group over time.*
FDA Label Image

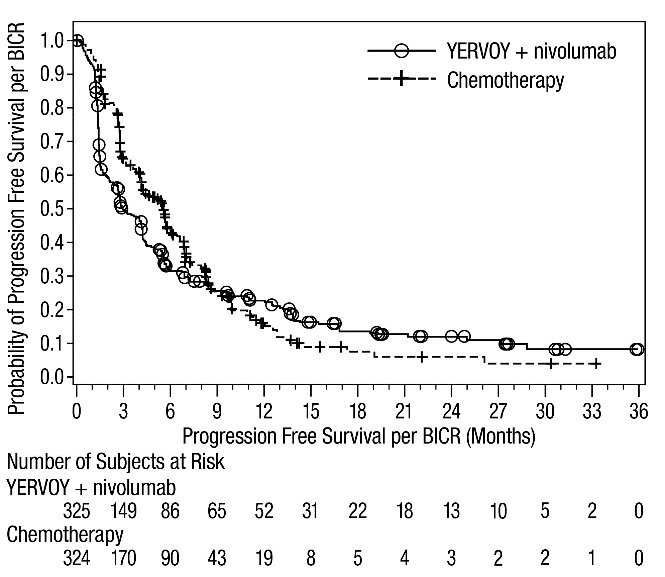
Yervoy Pfs Checkmate 648 A

Yervoy Pfs Checkmate 648 A
A Kaplan-Meier survival curve chart showing the probability of progression-free survival per BICR over 36 months. It compares two groups: YERVOY combined with nivolumab versus chemotherapy. The x-axis represents months, and the y-axis shows the survival probability. The chart includes a table of subjects at risk for both groups at various time points.*
FDA Label Image

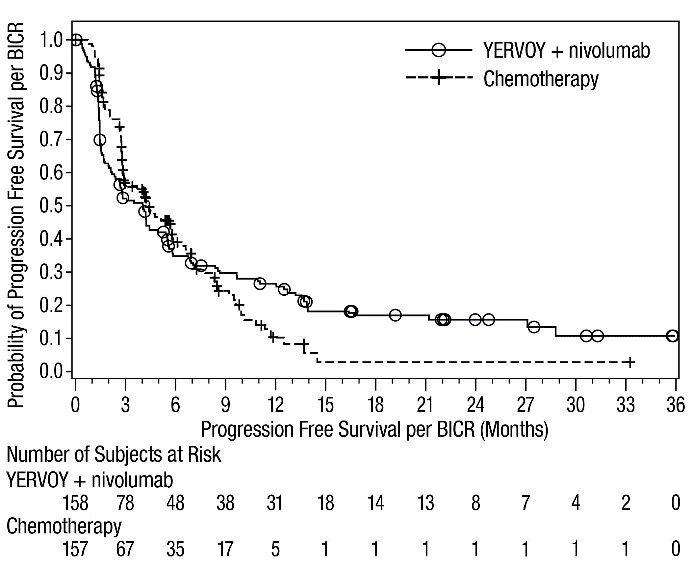
Yervoy Pfs Checkmate 648 B

Yervoy Pfs Checkmate 648 B
A Kaplan-Meier survival curve graph showing the probability of progression-free survival per BICR over time in months, comparing YERVOY + nivolumab treatment and chemotherapy. The graph includes the number of subjects at risk for each treatment group at various time points up to 36 months.*

* About these descriptions: Image descriptions on this page are generated by automated AI analysis of the product label images from the manufacturer's FDA label submission (SPL). They are provided for reference only and may contain errors or omissions. Always rely on the printed label itself and the official FDA labeling, and consult a pharmacist or healthcare professional with any questions about this product.