Opdivo Injection
Product Images NDC 0003-3756

39 FDA label images from E.r. Squibb & Sons, L.l.c. · Packaging, Regulatory Labels, and Product Appearance

Product Visual Gallery

This gallery contains 39 technical images submitted to the FDA as part of the official labeling for Opdivo (NDC 0003-3756). Unlike standard consumer photos, these assets often include clinical data figures, molecular chemical structures, and official manufacturer packaging layouts.

As provided by E.r. Squibb & Sons, L.l.c., these visuals offer a comprehensive scientific overview of the product's physical and chemical identity, aiding pharmacists and researchers in product verification and study.

Product Images & Figures Index

FDA Label Image

Opdivo-os-checkmate-037.jpg (Opdivo Os Checkmate 037)
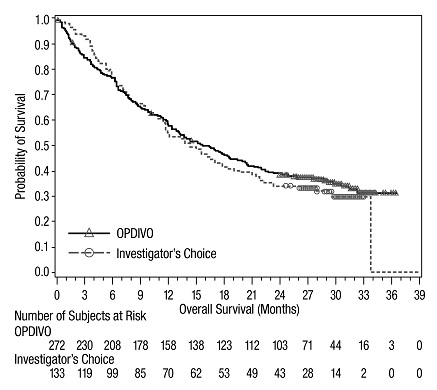
Opdivo-os-checkmate-037.jpg (Opdivo Os Checkmate 037)
A Kaplan-Meier survival curve chart depicting overall survival probability over months for two groups: OPDIVO and Investigator's Choice. The x-axis represents overall survival in months (0 to 39), and the y-axis represents the probability of survival (0 to 1). The plot includes a table showing the number of subjects at risk for each group at various time points.*
FDA Label Image

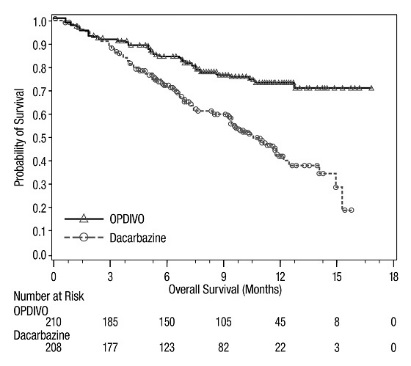
Opdivo-os-checkmate-066.jpg (Opdivo Os Checkmate 066)

Opdivo-os-checkmate-066.jpg (Opdivo Os Checkmate 066)
A Kaplan-Meier plot showing overall survival over 18 months comparing OPDIVO (nivolumab) and Dacarbazine. The y-axis represents the probability of survival, and the x-axis shows time in months. The chart includes a table of numbers at risk for each treatment group at various time points.*
FDA Label Image

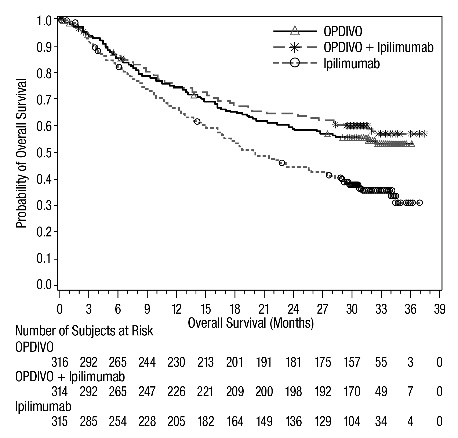
Opdivo-os-checkmate-067.jpg (Opdivo Os Checkmate 067)

Opdivo-os-checkmate-067.jpg (Opdivo Os Checkmate 067)
A Kaplan-Meier survival curve chart showing overall survival probability over time (months) for three groups: OPDIVO, OPDIVO + Ipilimumab, and Ipilimumab. The x-axis represents overall survival in months up to 39 months, and the y-axis represents the probability of overall survival ranging from 0.0 to 1.0. The chart includes a table of the number of subjects at risk for each group at various time points.*
FDA Label Image

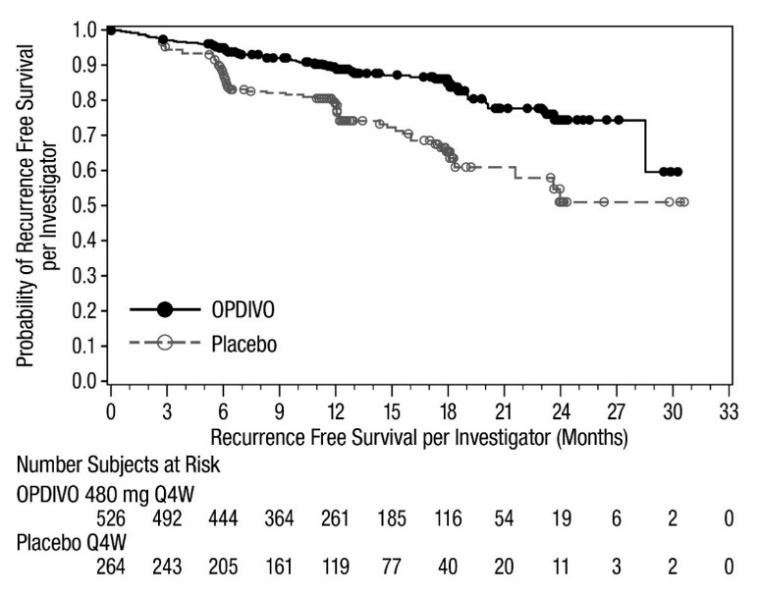
Opdivo-rfs-checkmate-76k (Opdivo Rfs Checkmate 76k)

Opdivo-rfs-checkmate-76k (Opdivo Rfs Checkmate 76k)
A Kaplan-Meier survival curve chart comparing the probability of recurrence-free survival per investigator between OPDIVO and placebo over a 33-month period. The x-axis represents months of recurrence-free survival, and the y-axis shows the probability of recurrence-free survival. The chart includes lines for OPDIVO (black solid line) and placebo (gray dashed line) with corresponding numbers of subjects at risk listed below the graph for each group at various time points.*
FDA Label Image

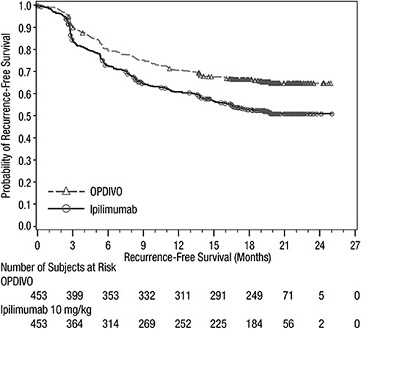
Opdivo-rfs-checkmate-238.jpg (Opdivo Rfs Checkmate 238)

Opdivo-rfs-checkmate-238.jpg (Opdivo Rfs Checkmate 238)
A line graph comparing the recurrence-free survival probability over 27 months for OPDIVO (nivolumab) versus Ipilimumab 10 mg/kg. The x-axis represents time in months, and the y-axis represents the probability of recurrence-free survival. The graph includes the number of subjects at risk for both treatments at multiple time points.*
FDA Label Image

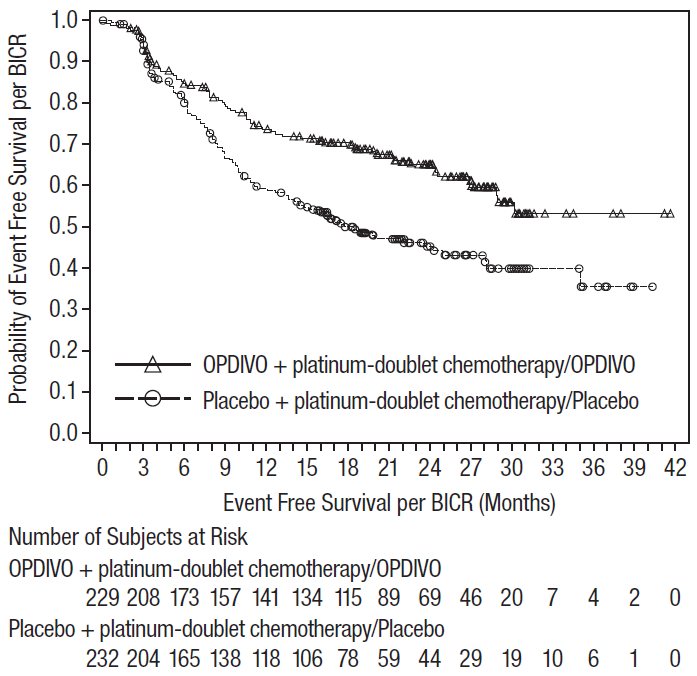
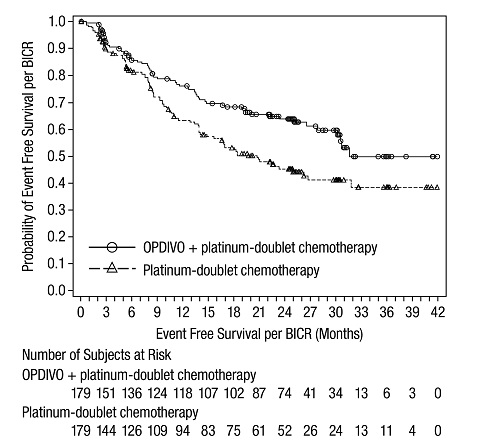
Opdivo-efs-checkmate-816.jpg (Opdivo Efs Checkmate 816)

Opdivo-efs-checkmate-816.jpg (Opdivo Efs Checkmate 816)
A Kaplan-Meier survival curve chart comparing event-free survival per BICR in months for OPDIVO plus platinum-doublet chemotherapy versus platinum-doublet chemotherapy alone. The y-axis represents the probability of event-free survival, and the x-axis shows months. Data points and number of subjects at risk over time are included for both treatment groups.*
FDA Label Image

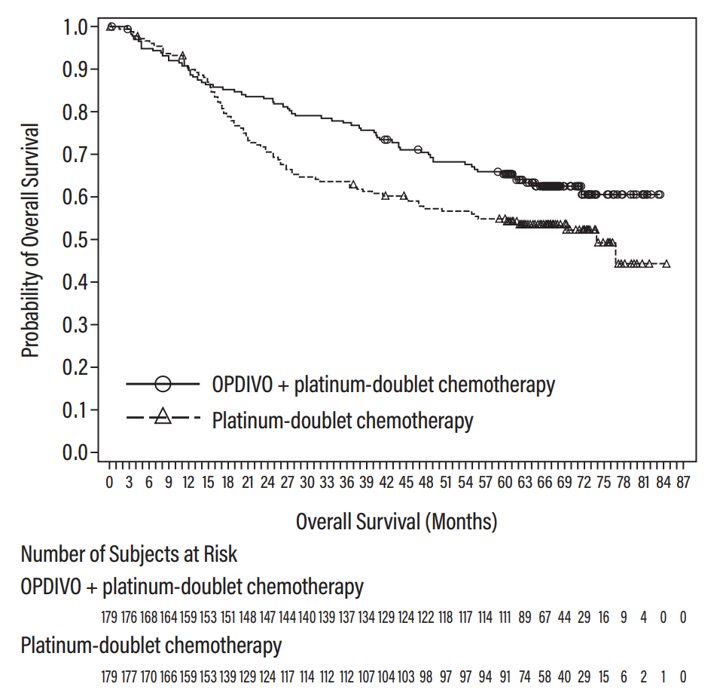
Fig On Checkmate 816 (Image 01)

Fig On Checkmate 816 (Image 01)
A Kaplan-Meier survival curve chart showing the probability of overall survival over time in months for two treatment groups: OPDIVO (nivolumab) plus platinum-doublet chemotherapy versus platinum-doublet chemotherapy alone. The chart includes survival probabilities on the y-axis and time in months on the x-axis, with a risk table indicating the number of subjects at risk for each group at various time points.*
FDA Label Image

Figure 8: Event Free Survival Checkmate 77t (Opdivo Efs Checkmate 77t)

Figure 8: Event Free Survival Checkmate 77t (Opdivo Efs Checkmate 77t)
A Kaplan-Meier survival curve chart showing the probability of event-free survival per BICR over months for OPDIVO + platinum-doublet chemotherapy compared to placebo + platinum-doublet chemotherapy. The x-axis represents event-free survival in months, and the y-axis represents probability ranging from 0 to 1. The chart includes subject numbers at risk at various time points for both treatment groups.*
FDA Label Image

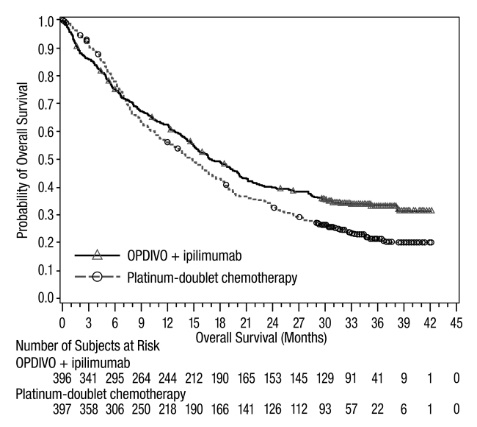
Opdivo-os-checkmate-227.jpg (Opdivo Os Checkmate 227)

Opdivo-os-checkmate-227.jpg (Opdivo Os Checkmate 227)
A Kaplan-Meier survival curve graph showing the probability of overall survival over months for patients treated with OPDIVO plus ipilimumab compared to platinum-doublet chemotherapy. The x-axis represents overall survival in months, and the y-axis shows the probability of overall survival. The graph includes the number of subjects at risk at various time points for each treatment group.*
FDA Label Image

Opdivo-os-checkmate-9la.jpg (Opdivo Os Checkmate 9la)

Opdivo-os-checkmate-9la.jpg (Opdivo Os Checkmate 9la)
A survival curve chart comparing overall survival probability over time in months between two treatment groups: OPDIVO (nivolumab) with ipilimumab plus platinum-doublet chemotherapy, and platinum-doublet chemotherapy alone. The chart includes the number of subjects at risk for each group at various time points along the x-axis from 0 to 27 months.*
FDA Label Image

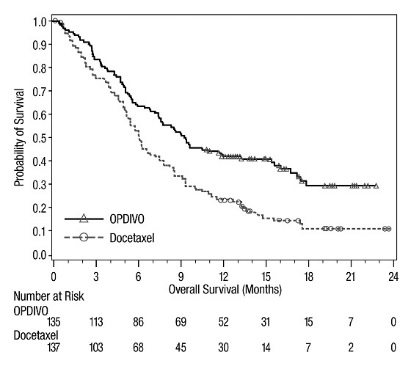
Opdivo-os-checkmate-017.jpg (Opdivo Os Checkmate 017)

Opdivo-os-checkmate-017.jpg (Opdivo Os Checkmate 017)
A Kaplan-Meier survival curve comparing the overall survival probability over 24 months for OPDIVO (nivolumab) versus Docetaxel. The y-axis shows the probability of survival, and the x-axis displays time in months. The graph includes the number of patients at risk at various time points for both treatments.*
FDA Label Image

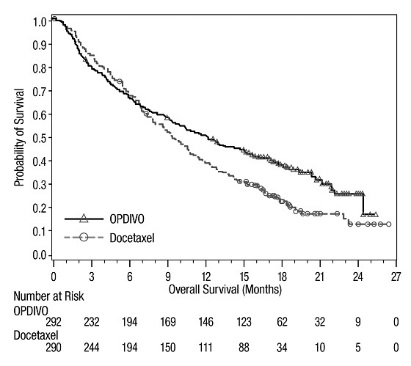
Opdivo-os-checkmate-057.jpg (Opdivo Os Checkmate 057)

Opdivo-os-checkmate-057.jpg (Opdivo Os Checkmate 057)
A Kaplan-Meier survival curve showing the probability of overall survival over 27 months for two treatments: OPDIVO (nivolumab) and Docetaxel. The graph plots survival probability on the vertical axis against time in months on the horizontal axis, with number at risk data displayed below the timeline.*
FDA Label Image

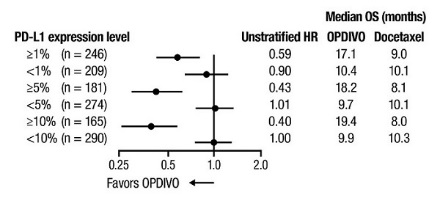
Opdivo-forest-os-checkmate-057.jpg (Opdivo Forest Os Checkmate 057)

Opdivo-forest-os-checkmate-057.jpg (Opdivo Forest Os Checkmate 057)
A forest plot chart comparing median overall survival (OS) in months for OPDIVO versus Docetaxel across different PD-L1 expression levels with associated unstratified hazard ratios (HR). The chart plots HR values, with markers for each PD-L1 subgroup indicating whether the result favors OPDIVO or Docetaxel.*
FDA Label Image

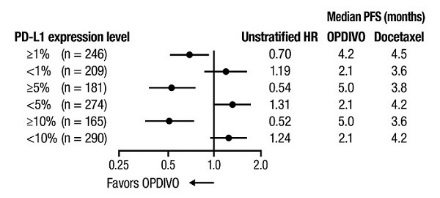
Opdivo-forest-pfs-checkmate-057.jpg (Opdivo Forest Pfs Checkmate 057)

Opdivo-forest-pfs-checkmate-057.jpg (Opdivo Forest Pfs Checkmate 057)
A Kaplan-Meier forest plot showing median progression-free survival (PFS) in months according to different PD-L1 expression levels. The plot compares unstratified hazard ratios (HR) and median PFS values for OPDIVO and Docetaxel treatments, with data points and confidence intervals illustrating relative efficacy favoring OPDIVO at various PD-L1 expression cutoffs.*
FDA Label Image

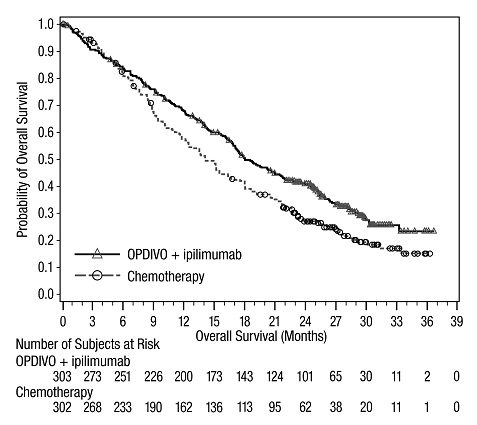
Opdivo-os-checkmate-743.jpg (Opdivo Os Checkmate 743)

Opdivo-os-checkmate-743.jpg (Opdivo Os Checkmate 743)
A Kaplan-Meier survival curve chart comparing overall survival probabilities over months for OPDIVO plus ipilimumab versus chemotherapy. The x-axis represents months of overall survival, and the y-axis shows the probability of overall survival. The chart includes the number of subjects at risk over time for each treatment group.*
FDA Label Image

Opdivo-os-checkmate-214.jpg (Opdivo Os Checkmate 214)

Opdivo-os-checkmate-214.jpg (Opdivo Os Checkmate 214)
A Kaplan-Meier survival curve showing the probability of overall survival over time in months for two groups: OPDIVO (nivolumab) combined with ipilimumab, and Sunitinib. The graph includes the number of subjects at risk at various time points for each treatment group.*
FDA Label Image

Opdivo-pfs-checkmate-9er.jpg (Opdivo Pfs Checkmate 9er)

Opdivo-pfs-checkmate-9er.jpg (Opdivo Pfs Checkmate 9er)
A Kaplan-Meier curve chart showing the probability of progression-free survival per BICR over months for OPDIVO plus Cabozantinib compared to Sunitinib. The chart includes survival probability on the y-axis and time in months on the x-axis, with patient numbers at risk listed below for both treatment groups.*
FDA Label Image

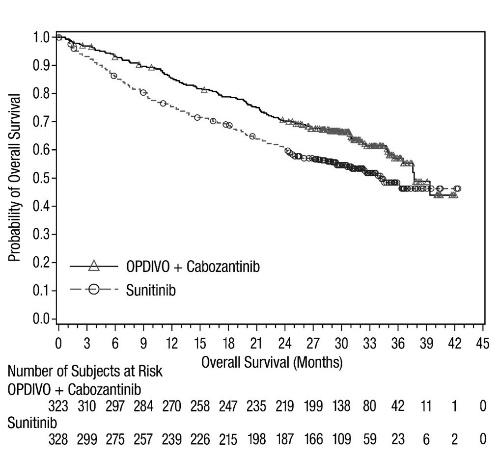
Opdivo-os-checkmate-9er-v2 (Opdivo Os Checkmate 9er V2)

Opdivo-os-checkmate-9er-v2 (Opdivo Os Checkmate 9er V2)
A Kaplan-Meier survival curve comparing overall survival probability over months for two treatment groups: OPDIVO plus Cabozantinib and Sunitinib. The graph shows the number of subjects at risk for each group over time, indicating survival trends up to approximately 42 months.*
FDA Label Image

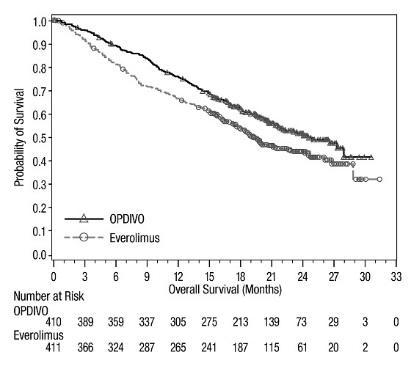
Opdivo-os-checkmate-025.jpg (Opdivo Os Checkmate 025)

Opdivo-os-checkmate-025.jpg (Opdivo Os Checkmate 025)
A Kaplan-Meier survival curve chart comparing overall survival probability over 33 months for OPDIVO (nivolumab) and Everolimus. The x-axis represents overall survival in months, and the y-axis shows the probability of survival. The chart includes the number of patients at risk at various time points for both treatments.*
FDA Label Image

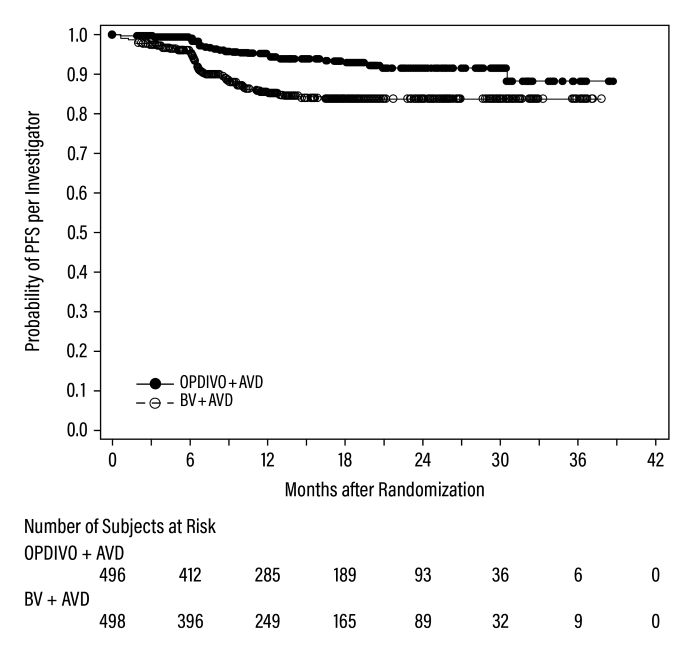
Opdivo-pfs-8ut (Opdivo Pfs 8ut)

Opdivo-pfs-8ut (Opdivo Pfs 8ut)
A Kaplan-Meier survival curve showing the probability of progression-free survival (PFS) per investigator over time in months after randomization. The chart compares two treatment groups: OPDIVO (nivolumab) plus AVD versus BV plus AVD, with corresponding number of subjects at risk listed below the x-axis for various time points up to 42 months.*
FDA Label Image

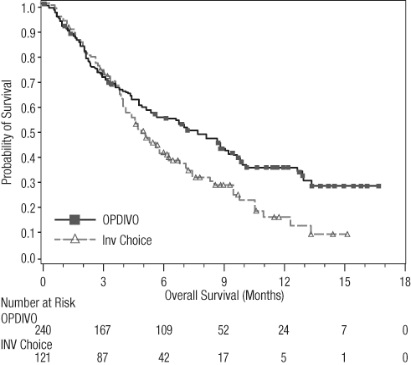
Opdivo-os-checkmate-141.jpg (Opdivo Os Checkmate 141)

Opdivo-os-checkmate-141.jpg (Opdivo Os Checkmate 141)
A Kaplan-Meier survival curve chart comparing overall survival probabilities over 18 months for OPDIVO injection versus an investigator's choice (Inv Choice) treatment. The graph shows survival probability on the y-axis and time in months on the x-axis, with a table below listing the number of patients at risk at various time points for OPDIVO and the comparator treatment.*
FDA Label Image

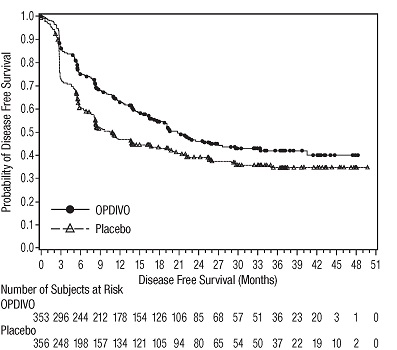
Opdivo-dfs-checkmate-274.jpg (Opdivo Dfs Checkmate 274)

Opdivo-dfs-checkmate-274.jpg (Opdivo Dfs Checkmate 274)
Kaplan-Meier survival curve chart comparing the probability of disease-free survival over 51 months between OPDIVO (nivolumab) and placebo groups. The chart includes a table of the number of subjects at risk per treatment group at various time points during the study.*
FDA Label Image

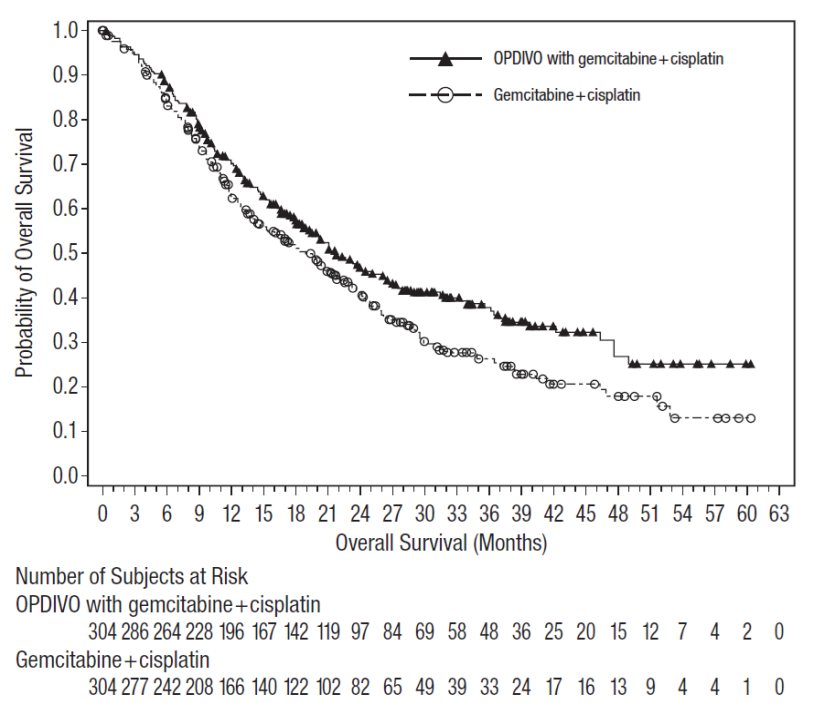
Overall Survival (CHECKMATE-901)

Overall Survival (CHECKMATE-901)
A Kaplan-Meier survival curve showing the probability of overall survival over 60 months. Two treatment groups are compared: OPDIVO with gemcitabine plus cisplatin (solid line with triangles) and gemcitabine plus cisplatin alone (dashed line with circles). The graph includes the number of subjects at risk at different time points for both groups.*
FDA Label Image

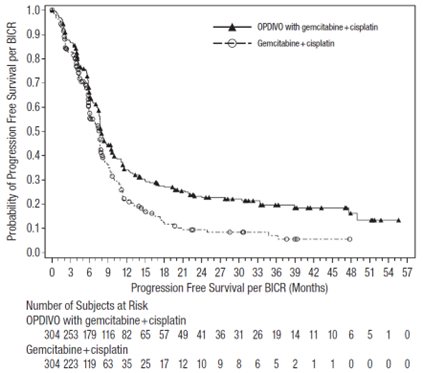
Progression Free Survival Checkmate-901 (Opdivo Pfs Checkmate 901)

Progression Free Survival Checkmate-901 (Opdivo Pfs Checkmate 901)
A Kaplan-Meier curve chart showing the probability of progression-free survival per BICR over time in months for OPDIVO (nivolumab) with gemcitabine plus cisplatin compared to gemcitabine plus cisplatin alone. The chart includes the number of subjects at risk at various time points for both treatment groups.*
FDA Label Image

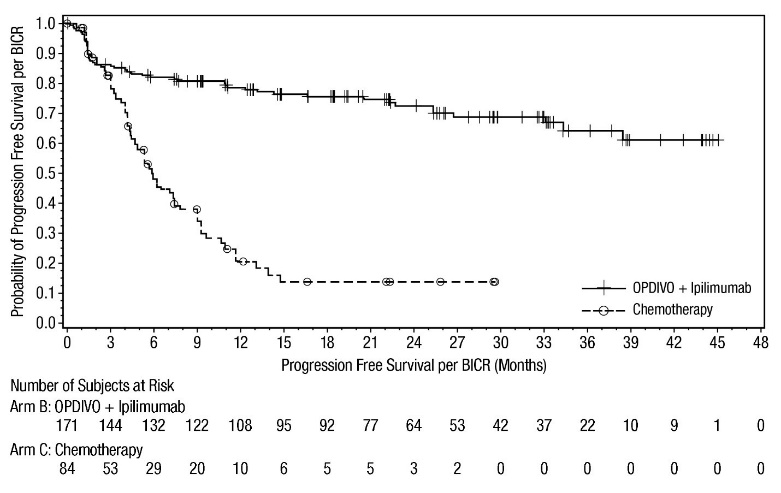
Pfs-first-line-opdivo-8hw (Pfs First Line Opdivo 8hw)

Pfs-first-line-opdivo-8hw (Pfs First Line Opdivo 8hw)
A Kaplan-Meier survival curve comparing progression free survival over time (in months) between OPDIVO plus ipilimumab and chemotherapy groups. The graph shows the probability of progression free survival per BICR, with OPDIVO plus ipilimumab demonstrating higher survival probabilities across the timeline. The number of subjects at risk is listed below the graph for each treatment arm at multiple time points up to 48 months.*
FDA Label Image

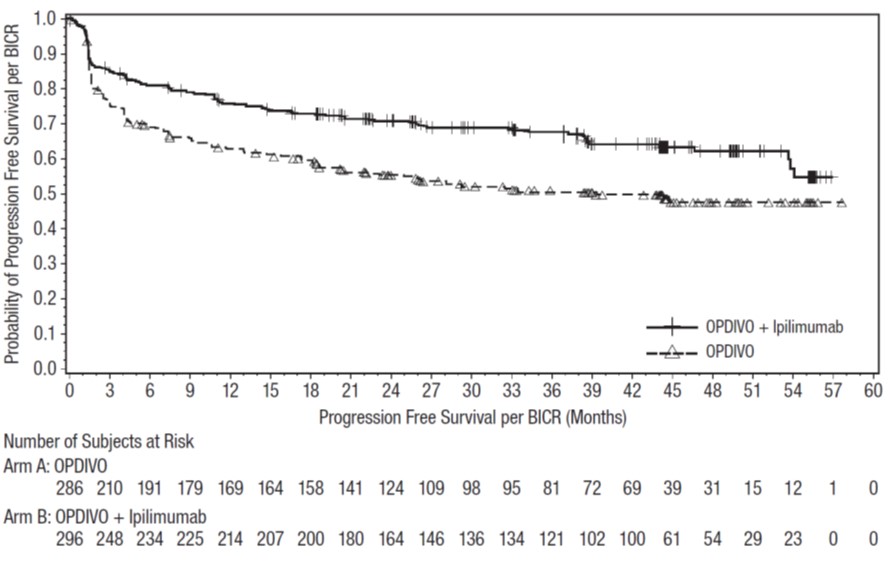
Pfs-all-lines-opdivo-8hw (Pfs All Lines Opdivo 8hw)

Pfs-all-lines-opdivo-8hw (Pfs All Lines Opdivo 8hw)
A Kaplan-Meier plot showing the probability of progression-free survival per BICR over approximately 60 months. Two groups are compared: OPDIVO (nivolumab) alone and OPDIVO with ipilimumab. The y-axis represents the probability of progression-free survival, while the x-axis shows time in months. The chart includes numbers of subjects at risk for each group at various time points.*
FDA Label Image

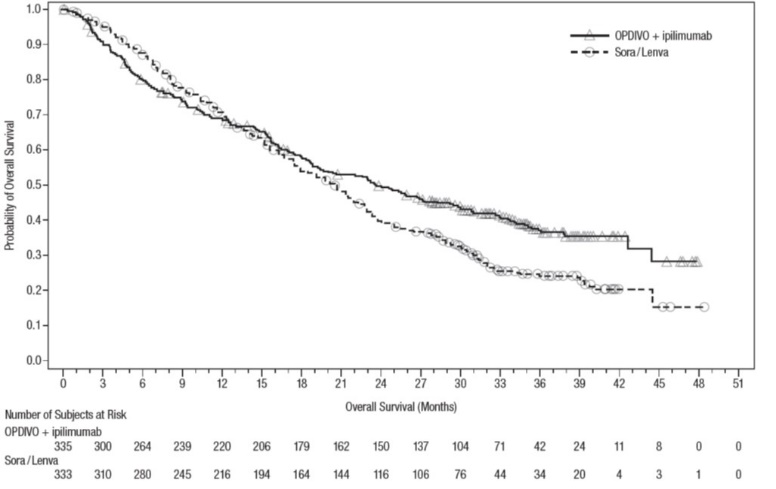
Opdivo-os-checkmate-9dw (Opdivo Os Checkmate 9dw)

Opdivo-os-checkmate-9dw (Opdivo Os Checkmate 9dw)
A Kaplan-Meier survival curve comparing the probability of overall survival over time (in months) between two treatment groups: OPDIVO (nivolumab) plus ipilimumab and Sora/Lenvu. The x-axis represents overall survival duration in months, and the y-axis shows the probability of overall survival. The chart also includes a table listing the number of subjects at risk over the study period for each group.*
FDA Label Image

Opdivo-dfs-checkmate-577.jpg (Opdivo Dfs Checkmate 577)

Opdivo-dfs-checkmate-577.jpg (Opdivo Dfs Checkmate 577)
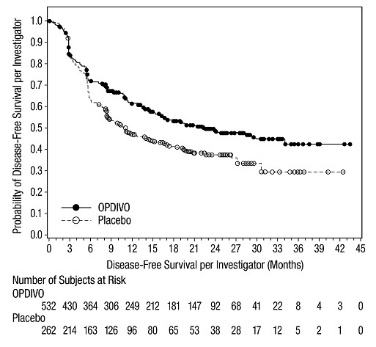
A Kaplan-Meier survival curve comparing disease-free survival probability over time between OPDIVO and placebo groups. The x-axis represents disease-free survival in months, and the y-axis shows the probability of disease-free survival per investigator. Two lines are shown: a solid line for OPDIVO and a dashed line for placebo, with OPDIVO demonstrating higher survival probabilities throughout the timeline. Below the graph, the number of subjects at risk for each group at various time points is tabulated.*
FDA Label Image

Opdivo-os-checkmate-648-a (Opdivo Os Checkmate 648 A)

Opdivo-os-checkmate-648-a (Opdivo Os Checkmate 648 A)
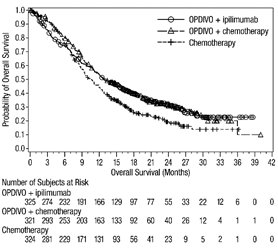
A Kaplan-Meier survival curve comparing overall survival probabilities over 42 months among three treatment groups: OPDIVO + ipilimumab, OPDIVO + chemotherapy, and chemotherapy alone. The x-axis represents overall survival in months, and the y-axis shows the probability of overall survival. A table below the graph lists the number of subjects at risk at specific time points for each group.*
FDA Label Image

Opdivo-os-checkmate-648-b (Opdivo Os Checkmate 648 B)

Opdivo-os-checkmate-648-b (Opdivo Os Checkmate 648 B)
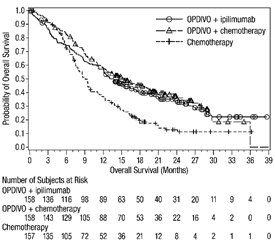
A survival curve graph depicting overall survival probability over months for three treatment groups: OPDIVO plus ipilimumab, OPDIVO plus chemotherapy, and chemotherapy alone. The graph shows comparisons of patient survival probabilities up to 39 months, with accompanying tables indicating the number of subjects at risk for each group at various time points.*
FDA Label Image

Opdivo-pfs-checkmate-648-a (Opdivo Pfs Checkmate 648 A)

Opdivo-pfs-checkmate-648-a (Opdivo Pfs Checkmate 648 A)
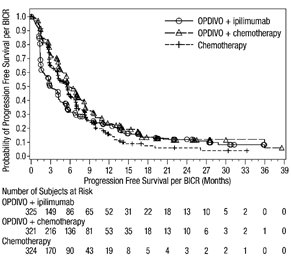
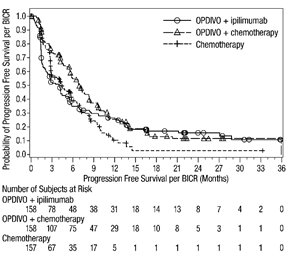
A line chart depicting Probability of Progression Free Survival per BICR over months (0 to about 39). It compares three treatments: OPDIVO plus ipilimumab, OPDIVO plus chemotherapy, and chemotherapy alone, with corresponding survival probabilities plotted over time. A table below the graph shows the number of subjects at risk for each treatment group at various time points during the study.*
FDA Label Image

Opdivo-pfs-checkmate-648-b (Opdivo Pfs Checkmate 648 B)

Opdivo-pfs-checkmate-648-b (Opdivo Pfs Checkmate 648 B)
A Kaplan-Meier curve depicting the probability of progression-free survival per BICR over time in months for three treatment groups: OPDIVO + ipilimumab, OPDIVO + chemotherapy, and chemotherapy alone. The chart includes markers for each group and a risk table showing the number of subjects at risk at various time points during the study.*
FDA Label Image

Opdivo-os-attraction-3.jpg (Opdivo Os Attraction 3)

Opdivo-os-attraction-3.jpg (Opdivo Os Attraction 3)
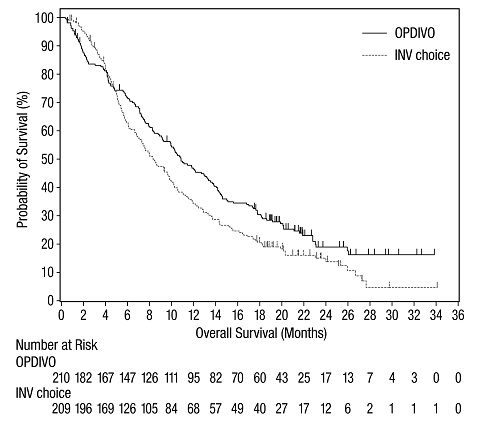
A Kaplan-Meier survival curve comparing overall survival probability over 36 months between OPDIVO (nivolumab) and INV choice treatments. The graph shows the probability of survival decreasing over time for both groups, with OPDIVO maintaining a higher survival probability compared to INV choice. The number of patients at risk at various time points is listed below the x-axis.*
FDA Label Image

Opdivo-os-pd-l1-cps-1-or-greater-checkmate-649.jpg (Opdivo Os Pd L1 Cps 1 Or Greater Checkmate 649)

Opdivo-os-pd-l1-cps-1-or-greater-checkmate-649.jpg (Opdivo Os Pd L1 Cps 1 Or Greater Checkmate 649)
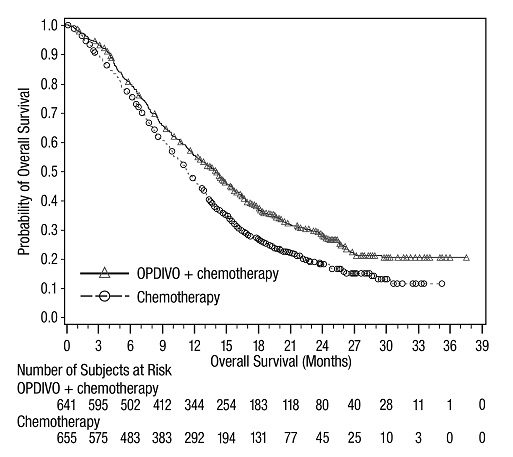
A Kaplan-Meier survival curve comparing overall survival probabilities over time (in months) between OPDIVO combined with chemotherapy and chemotherapy alone. The X-axis represents overall survival in months, ranging from 0 to 39, and the Y-axis shows the probability of overall survival, from 0 to 1. The number of subjects at risk is displayed below the graph for each treatment group at multiple time points.*
FDA Label Image

Opdivo-os-pd-l1-cps-5-or-greater-checkmate-649 (Opdivo Os Pd L1 Cps 5 Or Greater Checkmate 649)

Opdivo-os-pd-l1-cps-5-or-greater-checkmate-649 (Opdivo Os Pd L1 Cps 5 Or Greater Checkmate 649)
A line chart comparing the probability of overall survival over months between OPDIVO plus chemotherapy and chemotherapy alone. The x-axis shows overall survival in months up to 39, and the y-axis indicates the probability of overall survival from 0 to 1. A table beneath the chart displays the number of subjects at risk over time for both groups.*
FDA Label Image

Opdivo-40mg-4ml-ctn.jpg (Opdivo 40mg 4ml Ctn)

Opdivo-40mg-4ml-ctn.jpg (Opdivo 40mg 4ml Ctn)
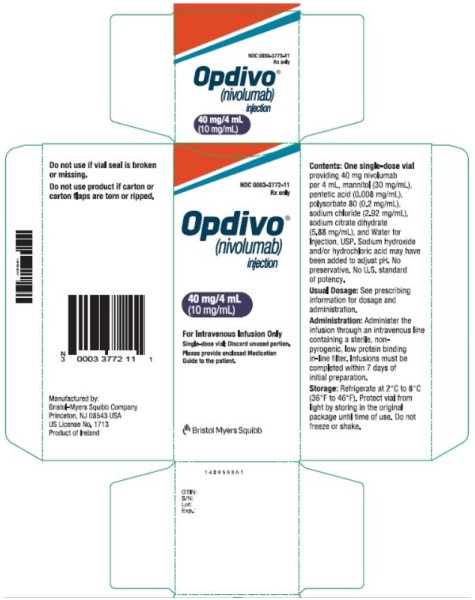
OPDIVO (nivolumab) injection 10 mg/mL (40 mg/4 mL) intravenous infusion carton label by E.R. Squibb & Sons, L.L.C. The label includes dosing information, storage instructions, and manufacturing details by Bristol-Myers Squibb Company, Princeton, NJ. It warns against use if vial seal is broken and advises discarding unused portions.*
FDA Label Image

Opdivo-100mg-10ml-ctn.jpg (Opdivo 100mg 10ml Ctn)

Opdivo-100mg-10ml-ctn.jpg (Opdivo 100mg 10ml Ctn)
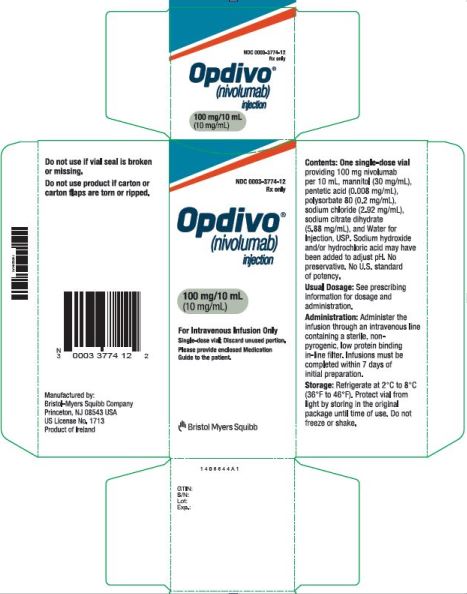
Packaging label for OPDIVO (nivolumab) injection, 100 mg per 10 mL (10 mg/mL) intravenous infusion. The label includes manufacturer information stating Bristol-Myers Squibb Company, Princeton, NJ, product of Ireland. Usage instructions indicate a single-dose vial with specific storage and administration guidelines. The label also includes a barcode and NDC 0003-3774-12.*
FDA Label Image

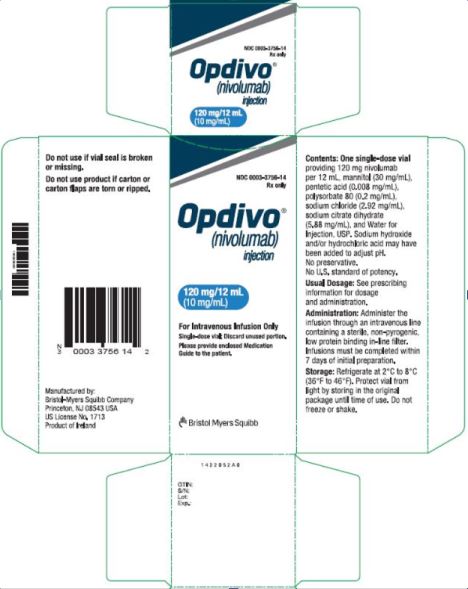
Opdivo-120mg-12ml-ctn.jpg (Opdivo 120mg 12ml Ctn)

Opdivo-120mg-12ml-ctn.jpg (Opdivo 120mg 12ml Ctn)
OPDIVO (nivolumab) injection 120 mg/12 mL (10 mg/mL) single-dose vial label by Bristol-Myers Squibb. The label includes product name, strength, dosage form as intravenous injection, barcode, content ingredients, storage instructions, and manufacturer details.*
FDA Label Image

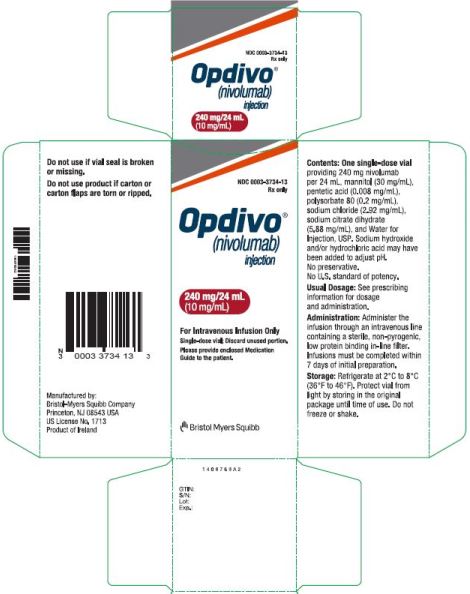
Opdivo-240mg-24ml-ctn.jpg (Opdivo 240mg 24ml Ctn)

Opdivo-240mg-24ml-ctn.jpg (Opdivo 240mg 24ml Ctn)
OPDIVO (nivolumab) Injection 240 mg/24 mL (10 mg/mL) carton label for intravenous infusion. The label includes usage instructions and storage information, emphasizing single-dose vial use and proper handling. Manufactured by Bristol Myers Squibb Company, the packaging displays the proprietary name, strength, dosage form, and route.*

* About these descriptions: Image descriptions on this page are generated by automated AI analysis of the product label images from the manufacturer's FDA label submission (SPL). They are provided for reference only and may contain errors or omissions. Always rely on the printed label itself and the official FDA labeling, and consult a pharmacist or healthcare professional with any questions about this product.