Product Images Galantamine Hydrobromide

View Photos of Packaging, Labels & Appearance

Product Label Images

The following 26 images provide visual information about the product associated with Galantamine Hydrobromide NDC 0054-0137 by Hikma Pharmaceuticals Usa Inc., such as packaging, labeling, and the appearance of the drug itself. This resource could be helpful for medical professionals, pharmacists, and patients seeking to verify medication information and ensure they have the correct product.

bottle.jpg - bottle

bottle.jpg - bottle

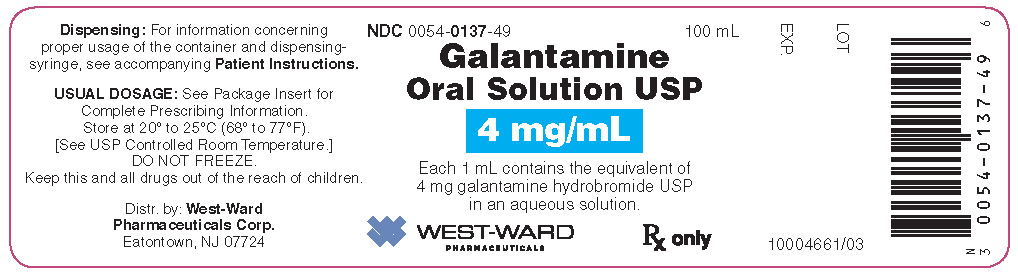
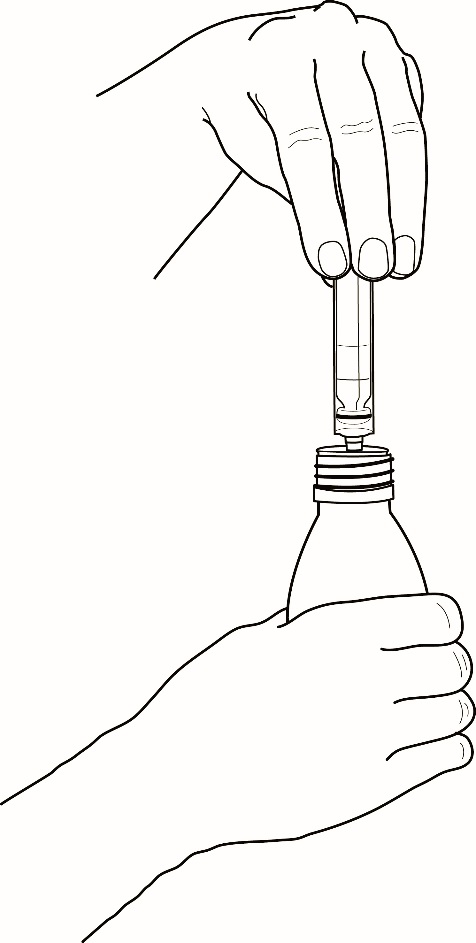
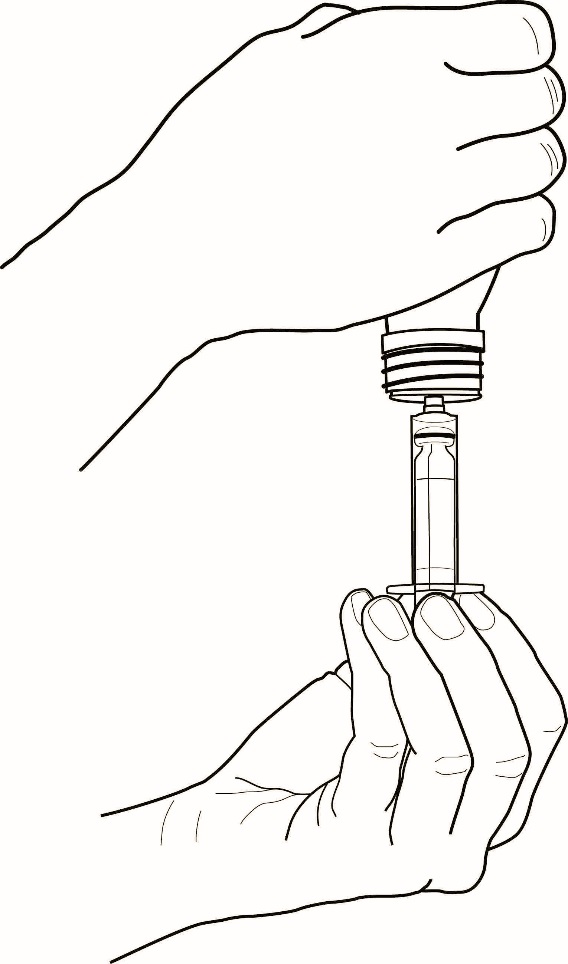
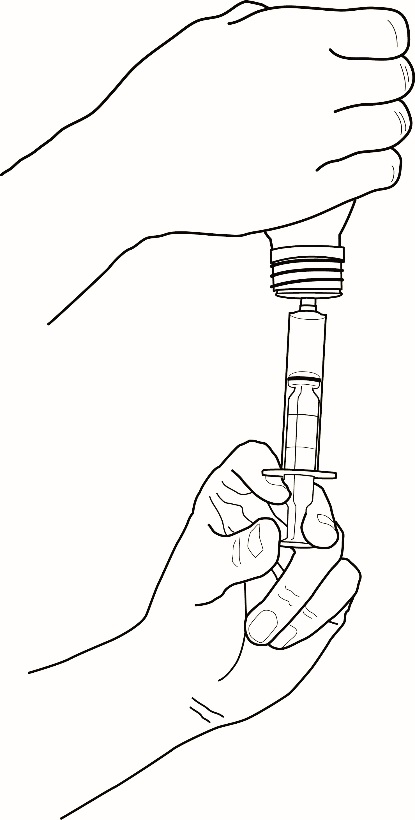
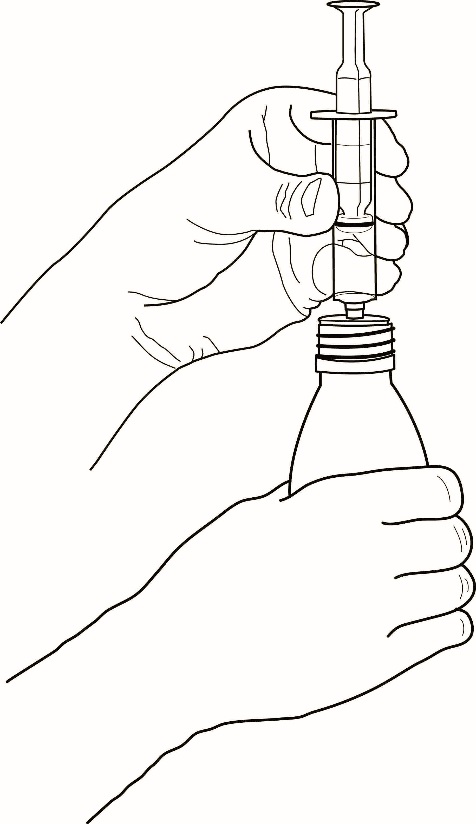
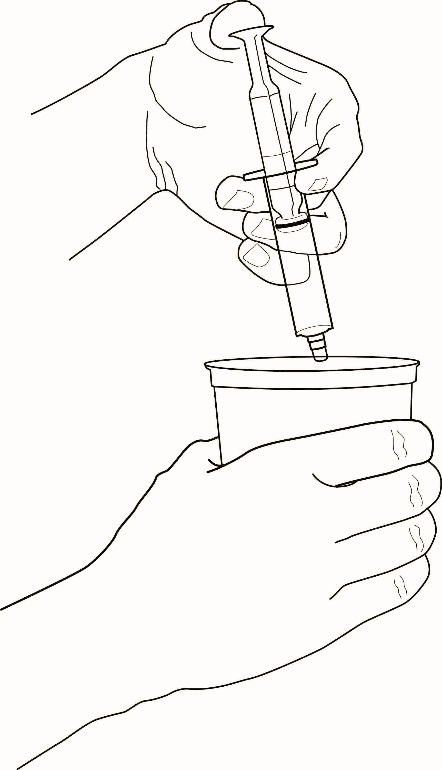
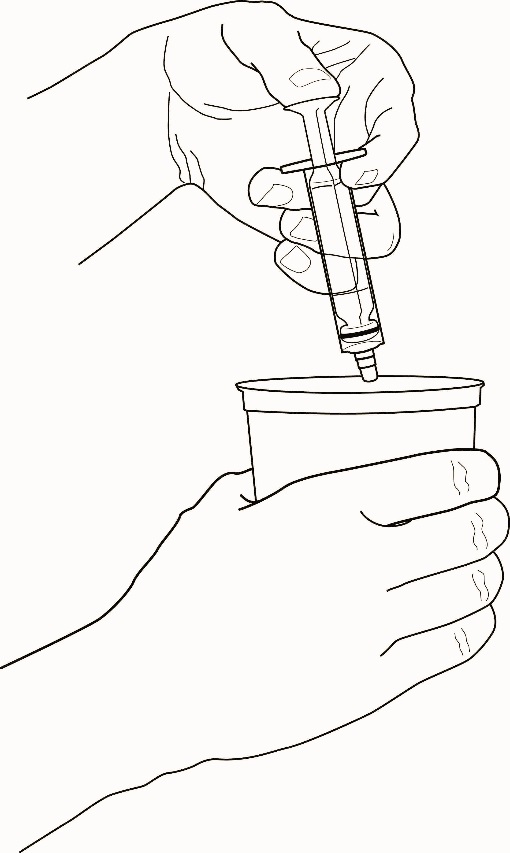
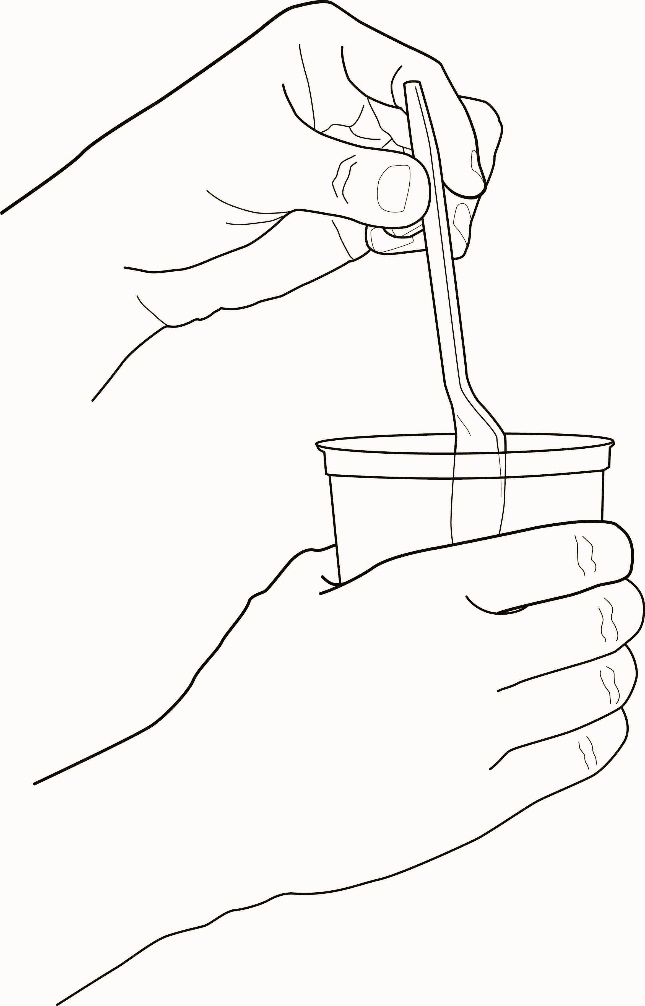
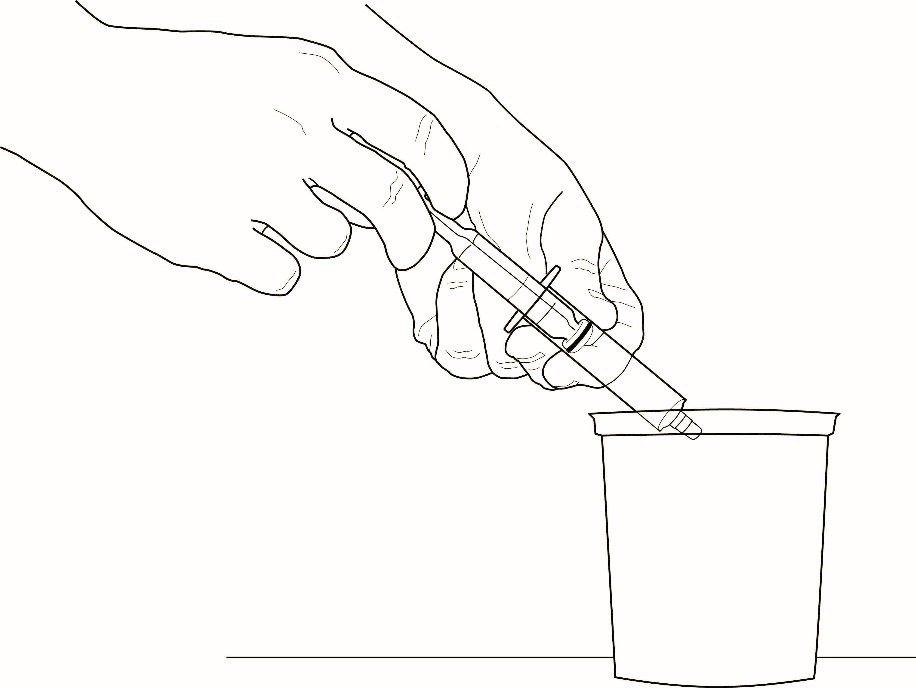
This text provides information about dispensing and storing a medication called Galantamine Oral Solution USP, which contains 4mg of galantamine hydrobromide per 1 mL of aqueous solution. Instructions for proper usage of the container and dispensing-syringe can be found in the accompanying Patient Instructions. The Package Insert should be consulted for complete prescribing information and usual dosage. The solution should be stored at 20°C to 25°C, and not frozen. This medication is distributed by West-Ward Pharmaceuticals Corp. and comes in a 100 mL bottle. The NDC number for this medication is 0054-0137-49. Keep this drug and all others out of the reach of children.*

chem.jpg - chem

chem.jpg - chem

figure-1.jpg - figure 1

figure-1.jpg - figure 1

gal-figure-1-01.jpg - gal figure 1 01

gal-figure-1-01.jpg - gal figure 1 01

This appears to be a table or chart with scattered numbers and symbols. It is not clear what this table represents, as the headings or context are missing. Therefore, the description cannot be generated.*

gal-figure-10-01.jpg - gal figure 10 01

gal-figure-10-01.jpg - gal figure 10 01

The text seems to indicate a dosage of 24mg/day and a placebo in a study that lasted for four weeks. The remaining text is not readable and appears to be a mix of characters and symbols.*

gal-figure-11-01.jpg - gal figure 11 01

gal-figure-11-01.jpg - gal figure 11 01

gal-figure-12-01.jpg - gal figure 12 01

gal-figure-12-01.jpg - gal figure 12 01

gal-figure-2-01.jpg - gal figure 2 01

gal-figure-2-01.jpg - gal figure 2 01

gal-figure-3-01.jpg - gal figure 3 01

gal-figure-3-01.jpg - gal figure 3 01

This is a table that shows the percentage of patients who experienced improvement or worsening of CIBIC-plus rating (a measure of cognitive and functional ability) in relation to different doses of a medication and a placebo. The percentage ranges from 50 to 10, with 50 representing the highest percentage of patients who experienced improvement. The medication was given at 8mg/day, 16mg/day, and 24mg/day respectively. The table also shows the degree of improvement and worsening experienced by the patients.*

gal-figure-4-01.jpg - gal figure 4 01

gal-figure-4-01.jpg - gal figure 4 01

This text seems to describe a clinical trial involving a medication called Placebo. The medication is administered at two different dosages, 24mg/day and 32mg/day. The rest of the text seems to be gibberish, likely due to errors in .*

gal-figure-5-01.jpg - gal figure 5 01

gal-figure-5-01.jpg - gal figure 5 01

The text provides a graph showing the cumulative percentage of patients with ADAS-cog change from baseline. The graph also shows three points (-10 points, -7 points, and -4 points) where the score worsens. There is a "No Change" category listed as well. The graph compares the effects of placebo with two doses of medication (24 mg/day and 32 mg/day) on ADAS-cog change.*

gal-figure-6-01.jpg - gal figure 6 01

gal-figure-6-01.jpg - gal figure 6 01

gal-figure-7-01.jpg - gal figure 7 01

gal-figure-7-01.jpg - gal figure 7 01

This appears to be a chart displaying dosages of a medication administered over a period of 13 weeks. The medication appears to have two different dosages, 32 mg/day and 24 mg/day, with a placebo also included. The remaining characters, including special characters such as "¥" and "—", do not provide any additional useful information.*

gal-figure-8-01.jpg - gal figure 8 01

gal-figure-8-01.jpg - gal figure 8 01

The given text seems to represent a graph that shows the cumulative percentage of patients with different scores. The scores are marked on the X-axis, such as -10 points, -7 points, -4 points, and no change. Three treatments are compared with each other, which are represented by different lines with labels of Placebo, 24 mg/day, and 32 mg/day. The Y-axis shows the cumulative percentage of patients. The graph also shows the ADAS-cog change from the baseline.*

gal-figure-9-01.jpg - gal figure 9 01

gal-figure-9-01.jpg - gal figure 9 01

This appears to be a chart displaying the percentage of patients who showed various levels of improvement after taking different doses of a medication. The medication is not specified and there is not enough context to accurately interpret the chart.*

patient-gal-figure2.jpg - patient gal figure2

patient-gal-figure2.jpg - patient gal figure2

patient-gal-figure3a-2.jpg - patient gal figure3a 2

patient-gal-figure3a-2.jpg - patient gal figure3a 2

patient-gal-figure3b.jpg - patient gal figure3b

patient-gal-figure3b.jpg - patient gal figure3b

patient-gal-figure4a-2.jpg - patient gal figure4a 2

patient-gal-figure4a-2.jpg - patient gal figure4a 2

patient-gal-figure4b.jpg - patient gal figure4b

patient-gal-figure4b.jpg - patient gal figure4b

patient-gal-figure5a-2.jpg - patient gal figure5a 2

patient-gal-figure5a-2.jpg - patient gal figure5a 2

patient-gal-figure5b-2.jpg - patient gal figure5b 2

patient-gal-figure5b-2.jpg - patient gal figure5b 2

patient-gal-figure6-2.jpg - patient gal figure6 2

patient-gal-figure6-2.jpg - patient gal figure6 2

patient-gal-figure7.jpg - patient gal figure7

patient-gal-figure7.jpg - patient gal figure7

patient-gal-figure8a-2.jpg - patient gal figure8a 2

patient-gal-figure8a-2.jpg - patient gal figure8a 2

patient-gal-figure8b-2.jpg - patient gal figure8b 2

patient-gal-figure8b-2.jpg - patient gal figure8b 2

* The product label images have been analyzed using a combination of traditional computing and machine learning techniques. It should be noted that the descriptions provided may not be entirely accurate as they are experimental in nature. Use the information in this page at your own discretion and risk.