Tofacitinib Solution
Product Images NDC 0054-0821

View Photos of Packaging, Regulatory Labels, and Product Appearance

Product Visual Gallery

This gallery contains 22 technical images submitted to the FDA as part of the official labeling for Tofacitinib Solution (NDC 0054-0821). Unlike standard consumer photos, these assets often include clinical data figures, molecular chemical structures, and official manufacturer packaging layouts.

As provided by Hikma Pharmaceuticals Usa Inc., these visuals offer a comprehensive scientific overview of the product's physical and chemical identity, aiding pharmacists and researchers in product verification and study.

FDA Label Image

Figure 01 (Figure 1)
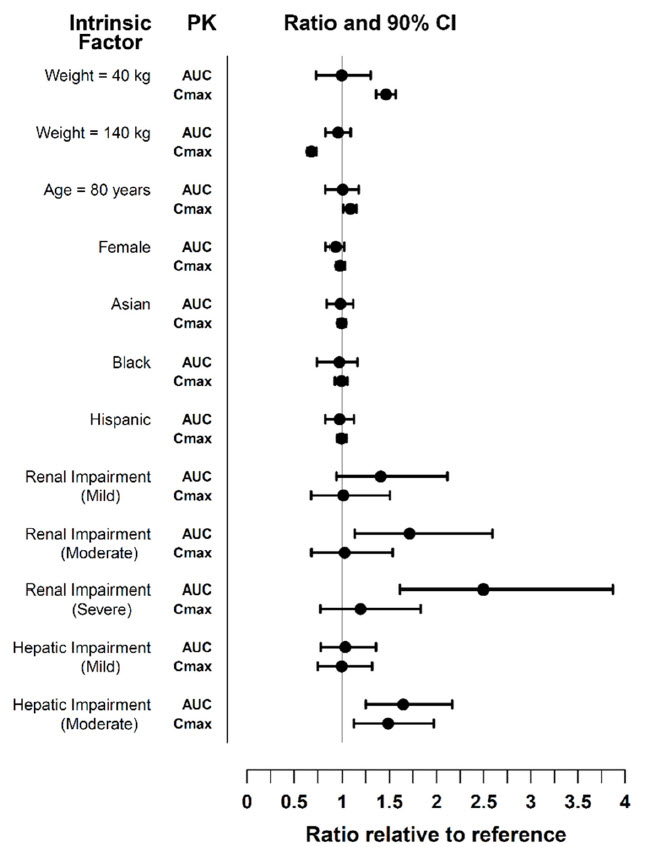
Figure 01 (Figure 1)
A forest plot chart showing pharmacokinetic (PK) ratios and 90% confidence intervals for various intrinsic factors such as weight, age, sex, race, and renal or hepatic impairment. The x-axis represents the ratio relative to reference, while the y-axis lists intrinsic factors with corresponding PK measures (AUC and Cmax). Data points with error bars illustrate variation in these PK parameters relative to reference values.*
FDA Label Image

Figure 02 (Figure 2)

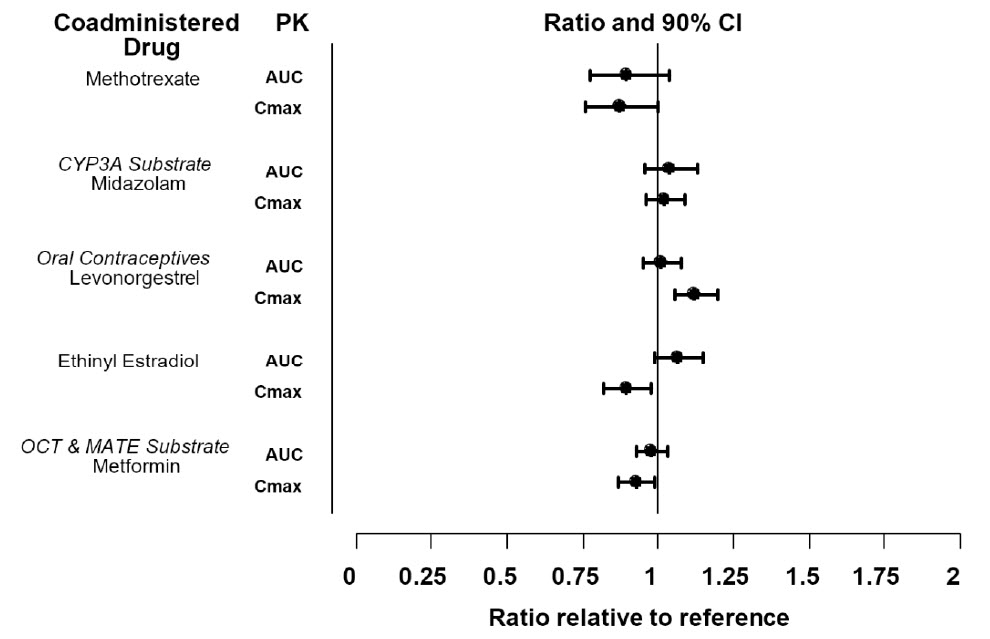
Figure 02 (Figure 2)
A pharmacokinetic (PK) graph showing ratios and 90% confidence intervals for the area under the curve (AUC) and maximum concentration (Cmax) of various coadministered drugs relative to reference values. The drugs include Methotrexate, Midazolam (CYP3A substrate), Levonorgestrel and Ethinyl Estradiol (oral contraceptives), and Metformin (OCT & MATE substrate). The horizontal axis represents the ratio relative to reference from 0 to 2.*
FDA Label Image

Figure 03 (Figure 3)

Figure 03 (Figure 3)
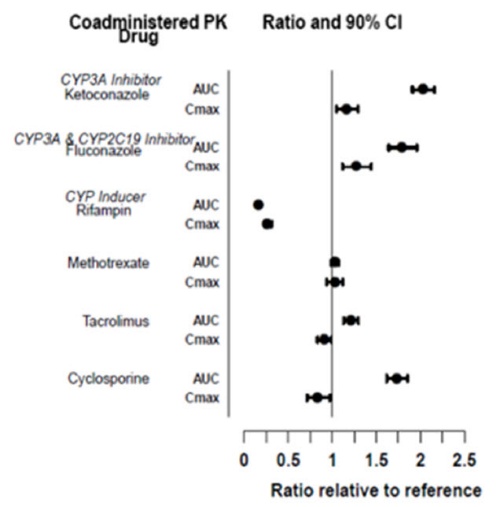
A chart showing ratio and 90% confidence intervals for pharmacokinetic parameters AUC and Cmax of various coadministered drugs compared to a reference. The drugs listed include ketoconazole, fluconazole, rifampin, methotrexate, tacrolimus, and cyclosporine. The x-axis represents the ratio relative to the reference, ranging from 0 to 2.5.*
FDA Label Image

Figure-4.jpg (Figure 4)

Figure-4.jpg (Figure 4)
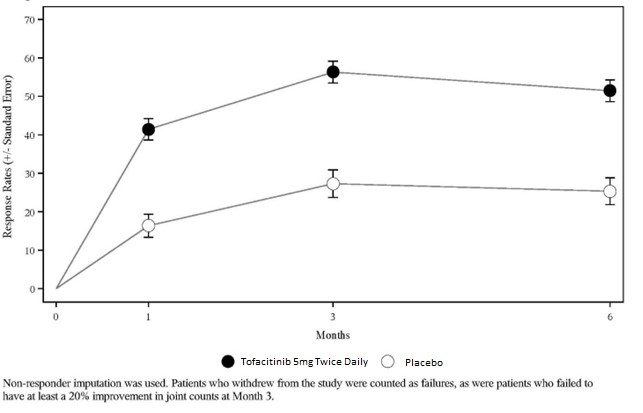
A line graph showing response rates with standard error over 6 months comparing Tofacitinib 5 mg twice daily and placebo. The x-axis represents time in months (0, 1, 3, 6) and the y-axis shows response rates. Tofacitinib data points are higher throughout the period. The graph notes the use of non-responder imputation and defines response based on a 20% improvement in joint counts at Month 3.*
FDA Label Image

Figure-5.jpg (Figure 5)

Figure-5.jpg (Figure 5)
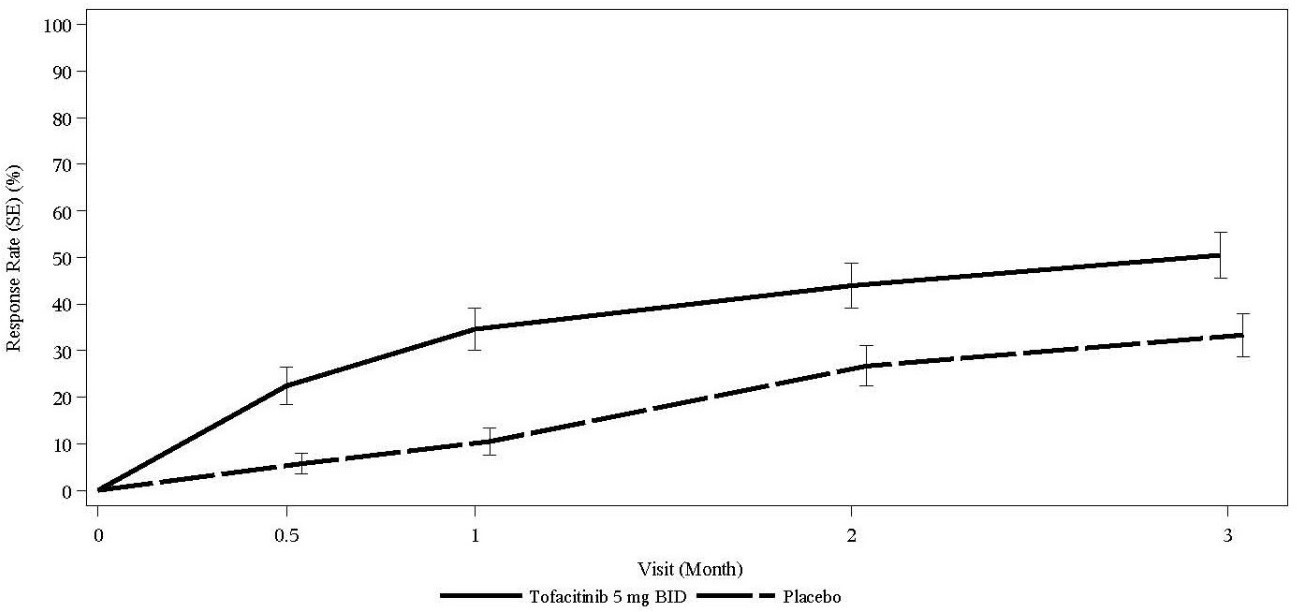
A line graph showing response rate percentage (with standard error bars) over a 3-month period comparing Tofacitinib 5 mg BID and placebo. The x-axis represents visit months (0, 0.5, 1, 2, 3) and the y-axis represents response rate (%) ranging from 0 to 100%. The graph shows a higher response rate for Tofacitinib compared to placebo throughout the visits.*
FDA Label Image

Figure-6.jpg (Figure 6)

Figure-6.jpg (Figure 6)
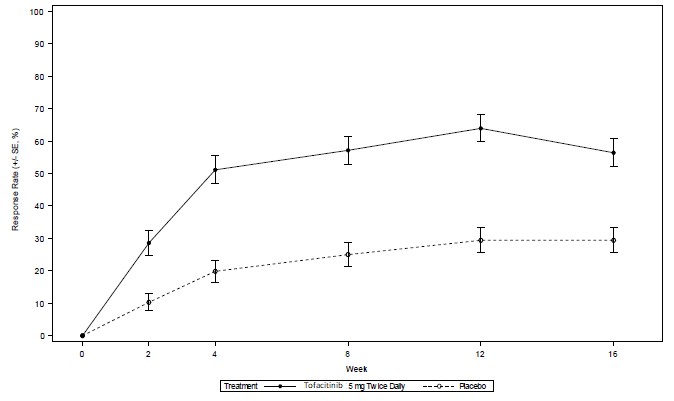
A line graph depicting response rate percentages over a 16-week period with two treatment groups. The x-axis represents weeks (0, 2, 4, 8, 12, 16) and the y-axis shows response rates from 0 to 100%. One solid line with diamond markers represents tofacitinib 5 mg twice daily treatment, while a dashed line with square markers indicates placebo. Both lines include error bars showing standard error.*
FDA Label Image

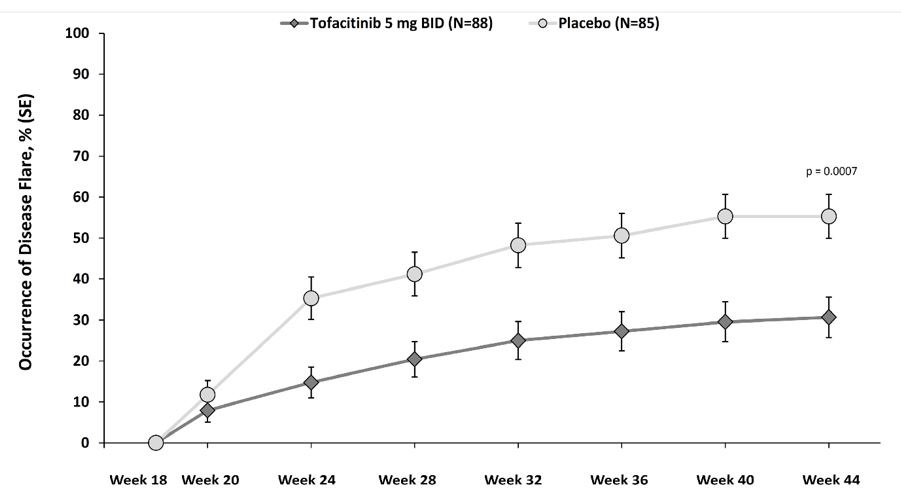
Figure-7.jpg (Figure 7)

Figure-7.jpg (Figure 7)
A line graph comparing the occurrence of disease flare percentage over time from Week 18 to Week 44 for two groups: Tofacitinib 5 mg BID (N=88) and Placebo (N=85). The y-axis represents occurrence of disease flare percentage with standard error, and the x-axis represents weeks. The Tofacitinib group shows a lower and more gradual increase compared to the Placebo group, with a significant p-value of 0.0007 noted at Week 44.*
FDA Label Image

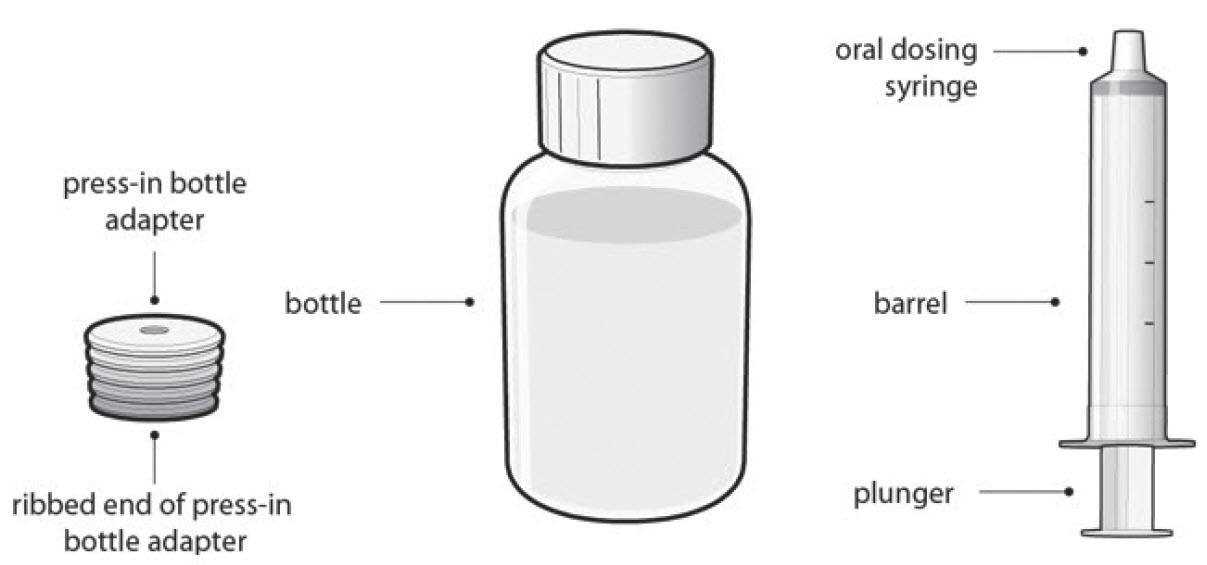
Ifu-image-step-00 (Ifu Figure 1)

Ifu-image-step-00 (Ifu Figure 1)
An instructional illustration showing the components for oral administration of tofacitinib solution. It includes a bottle containing the solution, a ribbed press-in bottle adapter, and an oral dosing syringe with labeled parts: barrel and plunger. This diagram outlines preparation and dosing equipment.*
FDA Label Image

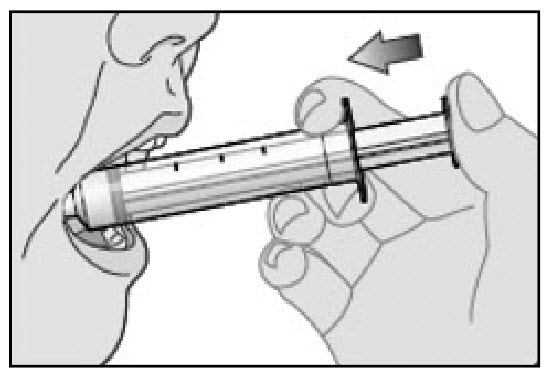
Ifu-image-step-09 (Ifu Figure 10)

Ifu-image-step-09 (Ifu Figure 10)
An instructional illustration showing a person using an oral syringe to administer medication by mouth. The image depicts the syringe being inserted into the person's mouth with an arrow indicating the plunger being pushed to dispense the liquid medication.*
FDA Label Image

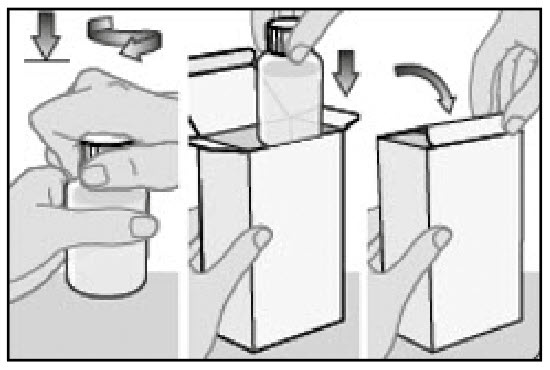
Ifu-image-step-10 (Ifu Figure 11)

Ifu-image-step-10 (Ifu Figure 11)
An instructional diagram showing the steps to open a carton containing a medication bottle. The first step depicts a hand pressing down on the bottle cap and turning it, the second step shows the bottle being placed inside an open carton, and the third step illustrates the carton being closed by folding the top flap.*
FDA Label Image

Ifu-image-step-11 (Ifu Figure 12)

Ifu-image-step-11 (Ifu Figure 12)
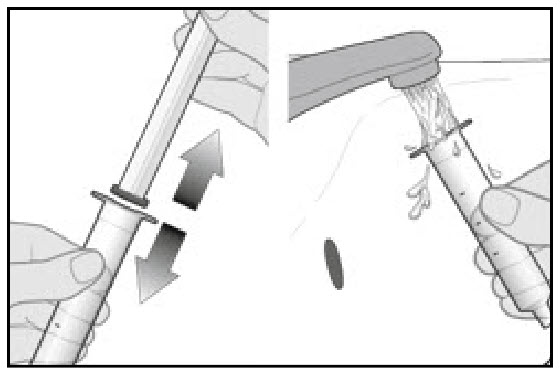
An instructional illustration showing two steps involving a dosing syringe for oral solution. The left panel depicts a hand moving the syringe plunger up and down. The right panel shows the syringe being rinsed under running water from a faucet.*
FDA Label Image

Ifu-image-step-01 (Ifu Figure 2)

Ifu-image-step-01 (Ifu Figure 2)
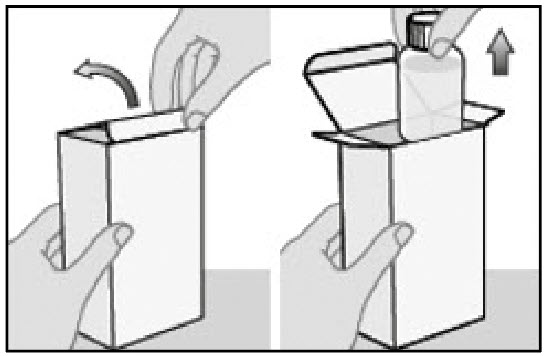
An instructional illustration showing the opening of a cardboard carton and the removal of a bottle from inside. The image depicts hands lifting the carton flap and then pulling the bottle upward out of the carton, indicating steps for accessing the medication inside.*
FDA Label Image

Ifu-image-step-02 (Ifu Figure 3)

Ifu-image-step-02 (Ifu Figure 3)
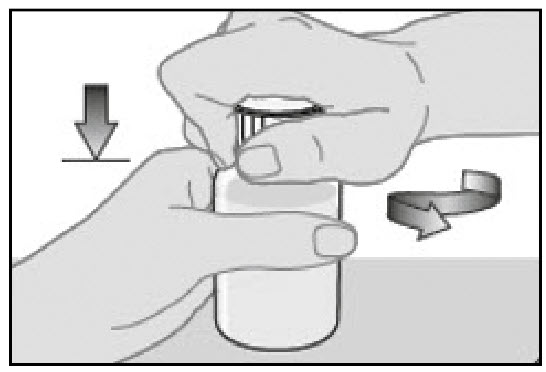
An instructional illustration showing two hands removing a cap from a pill bottle. One hand holds the bottle steady while the other twists the cap counterclockwise, with arrows indicating the twisting and downward motions.*
FDA Label Image

Ifu-image-step-03 (Ifu Figure 4)

Ifu-image-step-03 (Ifu Figure 4)
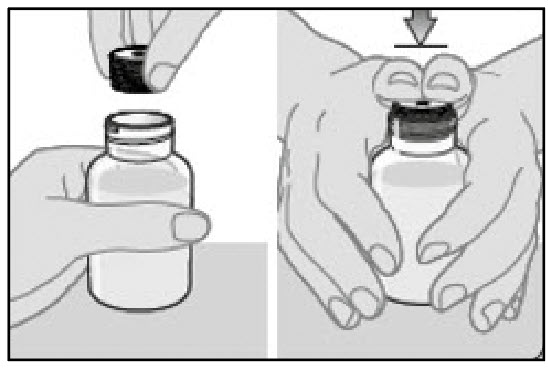
Illustration depicting two steps for opening a bottle of tofacitinib solution. The left image shows a hand removing the cap from the bottle. The right image shows the cap being pressed down while twisting to open the bottle, indicating a child-resistant closure mechanism.*
FDA Label Image

Ifu-image-step-04 (Ifu Figure 5)

Ifu-image-step-04 (Ifu Figure 5)
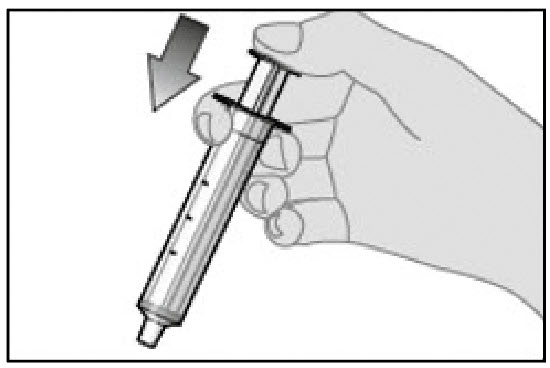
An instructional illustration showing a hand holding an oral syringe with an arrow indicating the plunger should be pressed downward. The syringe is used for measuring and administering tofacitinib oral solution.*
FDA Label Image

Ifu-image-step-05 (Ifu Figure 6)

Ifu-image-step-05 (Ifu Figure 6)
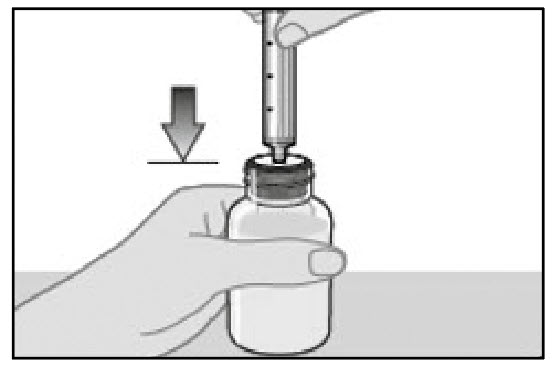
An instructional illustration showing a hand holding a bottle while a syringe is being inserted into the bottle's cap. An arrow points downward indicating to push or insert the syringe into the bottle. This instructional image is likely related to the preparation or administration of tofacitinib oral solution.*
FDA Label Image

Ifu-image-step-06 (Ifu Figure 7)

Ifu-image-step-06 (Ifu Figure 7)
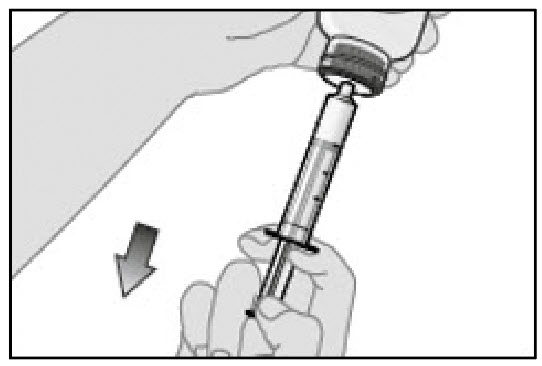
An instructional illustration showing a hand holding a syringe that is being filled from a vial, with a downward arrow indicating the direction of fluid transfer. The image demonstrates how to withdraw liquid medication from a vial using a syringe.*
FDA Label Image

Ifu-image-step-07 (Ifu Figure 8)

Ifu-image-step-07 (Ifu Figure 8)
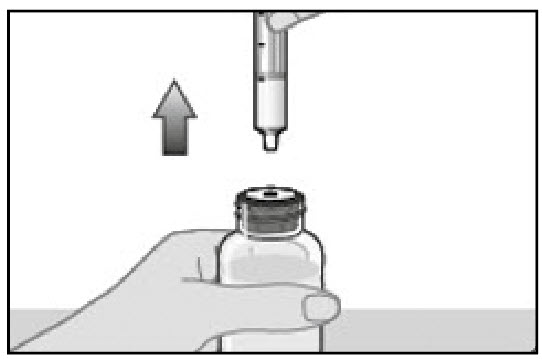
An illustration showing a hand holding a bottle with a dropper or pipette positioned above it. An arrow pointing upward indicates removal or extraction of the dropper or pipette from the bottle, suggesting a step in medication preparation or administration.*
FDA Label Image

Ifu-image-step-08 (Ifu Figure 9)

Ifu-image-step-08 (Ifu Figure 9)
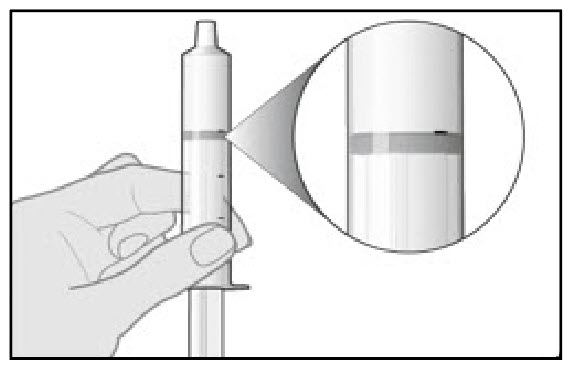
An instructional illustration showing a hand holding an oral dosing syringe with a magnified view highlighting the measurement markings on the syringe barrel for precise dose measurement of tofacitinib solution 1 mg/mL.*
FDA Label Image

Structure-formula.jpg (Image 01)

Structure-formula.jpg (Image 01)
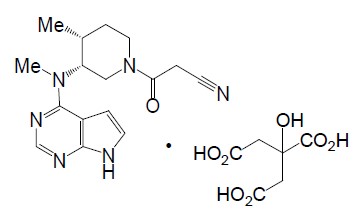
Chemical structure of tofacitinib presented alongside the structure of a co-crystallized acid. The diagram shows molecular details with rings, nitrogen atoms, and a cyanide group, illustrating the molecular composition of the active ingredient in tofacitinib solution.*
FDA Label Image

Tofacitinib-os-bottle-label-image (Tofacitinib Os Bottle Label Image)

Tofacitinib-os-bottle-label-image (Tofacitinib Os Bottle Label Image)
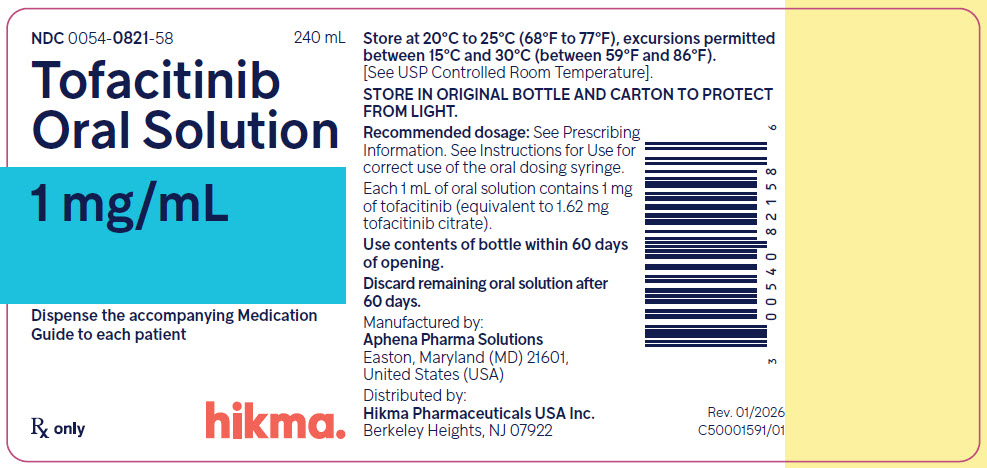
Label for Tofacitinib Oral Solution 1 mg/mL, an oral solution medication. The label includes storage instructions between 20°C to 25°C, a dosage note referring to the prescribing information, and usage instructions to discard remaining solution after 60 days. It is manufactured by Aphena Pharma Solutions and distributed by Hikma Pharmaceuticals USA Inc.*
FDA Label Image

Tofacitinib-os-folding-carton-image (Tofacitinib Os Folding Carton Image)

Tofacitinib-os-folding-carton-image (Tofacitinib Os Folding Carton Image)
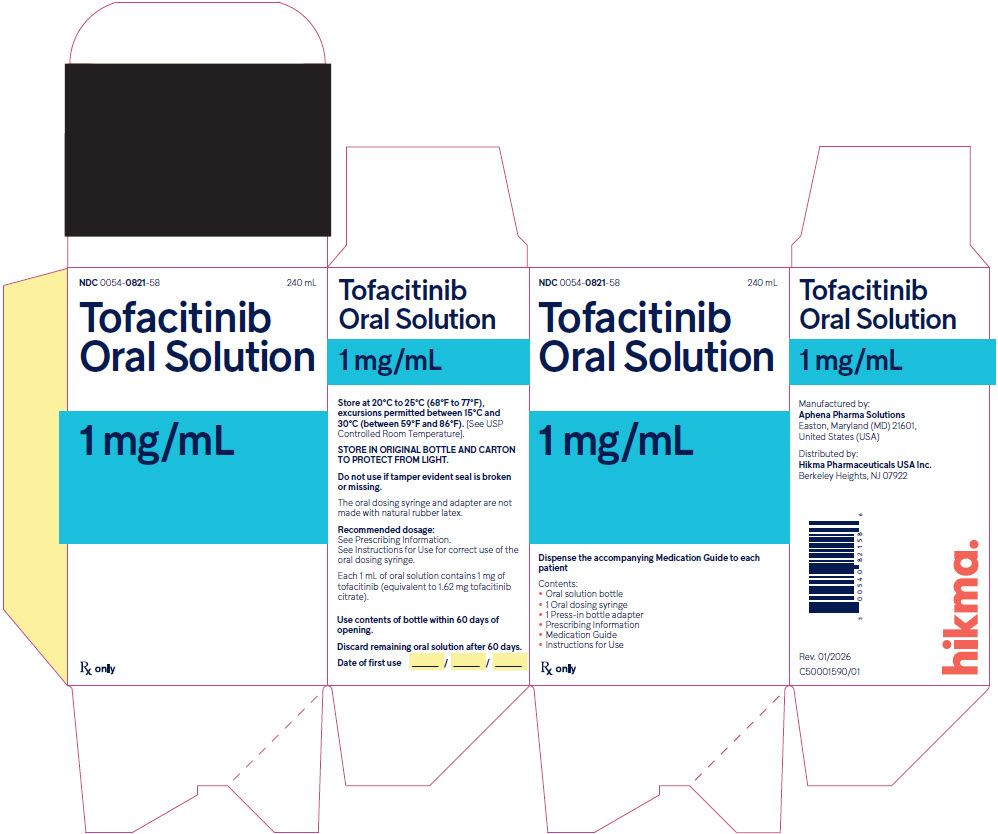
Packaging label for Tofacitinib Oral Solution 1 mg/mL by Hikma Pharmaceuticals USA Inc. The carton holds 240 mL of oral solution. It includes storage instructions (20°C to 25°C), usage guidelines, and distributor information. The label emphasizes dispensing an accompanying Medication Guide and contains a barcode and revision date.*

* About these descriptions: Image descriptions on this page are generated by automated AI analysis of the product label images from the manufacturer's FDA label submission (SPL). They are provided for reference only and may contain errors or omissions. Always rely on the printed label itself and the official FDA labeling, and consult a pharmacist or healthcare professional with any questions about this product.