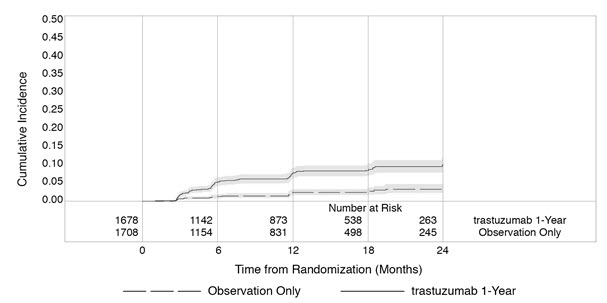
Figure 1 (Trazimera 01)
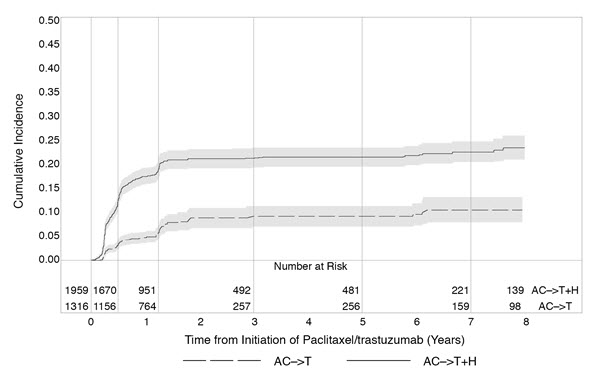
This appears to be a graph or chart titled "Cumulative Incidence" showing the number of cases per year (or time period) on the vertical axis and the time from the initiation of Pacitaxel-frastuzumab treatment in years on the horizontal axis. Additionally, there are numbers at Rk and two labels "ACSTuH" and "ACT". However, it is difficult to interpret the meaning of the graph without additional context.*