Simulect 01
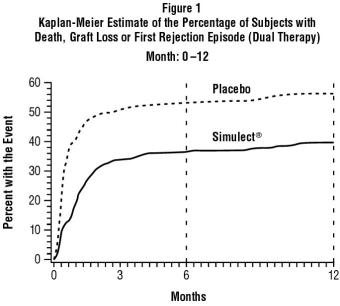
This appears to be a graph showing the Kaplan-Meier estimate of the percentage of subjects who experience death, graft loss, or their first rejection episode within the first year (0-12 months) after undergoing dual therapy. The x-axis may represent different time points, with 6 months being the first data point shown. The y-axis appears to show the percentage of subjects experiencing the defined events. The graph shows that at 6 months, approximately 50% of subjects have experienced one of the defined events.*