Tykerb Tablet
Product Images NDC 0078-0671

View Photos of Packaging, Regulatory Labels, and Product Appearance

Product Visual Gallery

This gallery contains 6 technical images submitted to the FDA as part of the official labeling for Tykerb (NDC 0078-0671). Unlike standard consumer photos, these assets often include clinical data figures, molecular chemical structures, and official manufacturer packaging layouts.

As provided by Novartis Pharmaceuticals Corporation, these visuals offer a comprehensive scientific overview of the product's physical and chemical identity, aiding pharmacists and researchers in product verification and study.

FDA Label Image

Lapatinib Ditosylate Monohydrate Chemical Structure (Tykerb Spl Graphic 01)
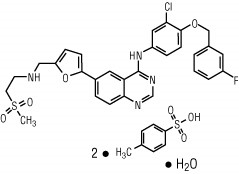
Lapatinib Ditosylate Monohydrate Chemical Structure (Tykerb Spl Graphic 01)
Chemical structure of lapatinib, the active ingredient in TYKERB tablets 250 mg, showing its molecular arrangement including functional groups and associated sulfate and water molecules.*
FDA Label Image

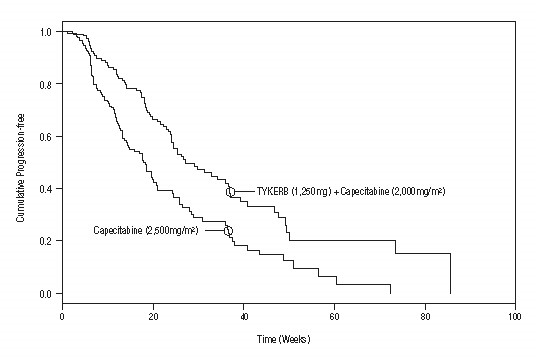
Figure 1 (Tykerb Spl Graphic 02)

Figure 1 (Tykerb Spl Graphic 02)
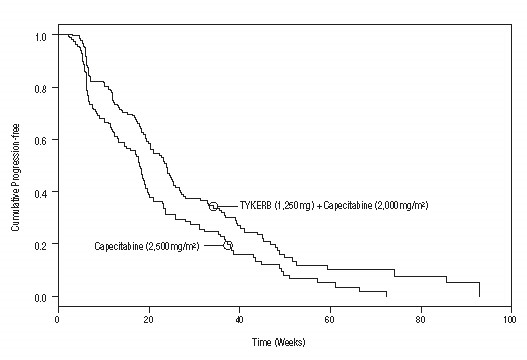
A Kaplan-Meier plot depicting cumulative progression-free survival over time in weeks for two treatment groups: TYKERB (1,250 mg) plus Capecitabine (2,000 mg/m2) and Capecitabine alone (2,500 mg/m2). The y-axis shows proportion progression-free, and the x-axis shows time in weeks, illustrating higher progression-free survival in the combination therapy group.*
FDA Label Image

Figure 2 (Tykerb Spl Graphic 03)

Figure 2 (Tykerb Spl Graphic 03)
A Kaplan-Meier survival curve comparing cumulative progression-free survival over time (weeks) between two treatments: TYKERB (lapatinib) 1,250 mg plus Capecitabine 2,000 mg/m² and Capecitabine alone at 2,500 mg/m². The graph plots progression-free survival proportion on the vertical axis and time in weeks on the horizontal axis.*
FDA Label Image

Figure 3 (Tykerb Spl Graphic 04)

Figure 3 (Tykerb Spl Graphic 04)
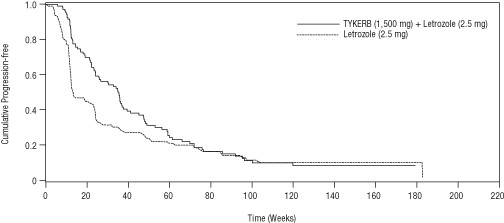
A line graph showing cumulative progression-free survival over time (in weeks) comparing two treatments: TYKERB (1,500 mg) plus Letrozole (2.5 mg) versus Letrozole (2.5 mg) alone. The y-axis represents the proportion of cumulative progression-free patients, ranging from 0 to 1, and the x-axis represents time in weeks, up to 220 weeks.*
FDA Label Image

Bottle Label (Tykerb Spl Graphic 05)

Bottle Label (Tykerb Spl Graphic 05)
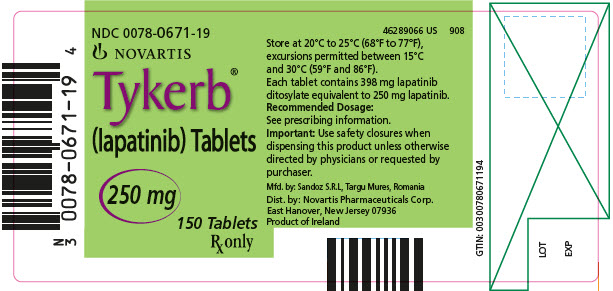
Packaging label for Tykerb (lapatinib) tablets, 250 mg strength, in a 150 tablet count. The label shows the Novartis Pharmaceuticals Corporation logo and details, including storage instructions and manufacturer information. The tablets are for oral use and prescription only. The label includes barcodes and batch data fields.*
FDA Label Image

Tykerb Spl Graphic 06

Tykerb Spl Graphic 06
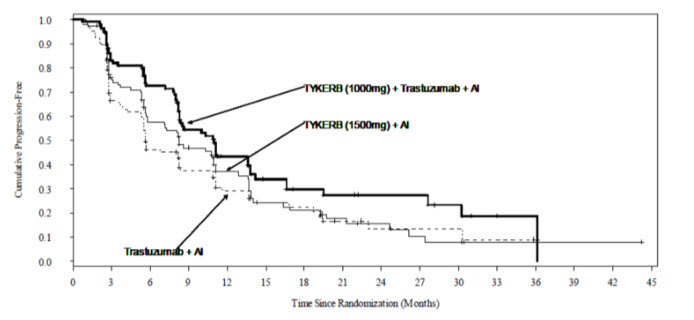
A Kaplan-Meier survival curve chart depicting cumulative progression-free status over time in months since randomization. The chart compares three treatment groups including two TYKERB (lapatinib) doses combined with other agents and a Trastuzumab plus AI group, illustrating differences in progression-free survival rates over approximately 45 months.*

* About these descriptions: Image descriptions on this page are generated by automated AI analysis of the product label images from the manufacturer's FDA label submission (SPL). They are provided for reference only and may contain errors or omissions. Always rely on the printed label itself and the official FDA labeling, and consult a pharmacist or healthcare professional with any questions about this product.