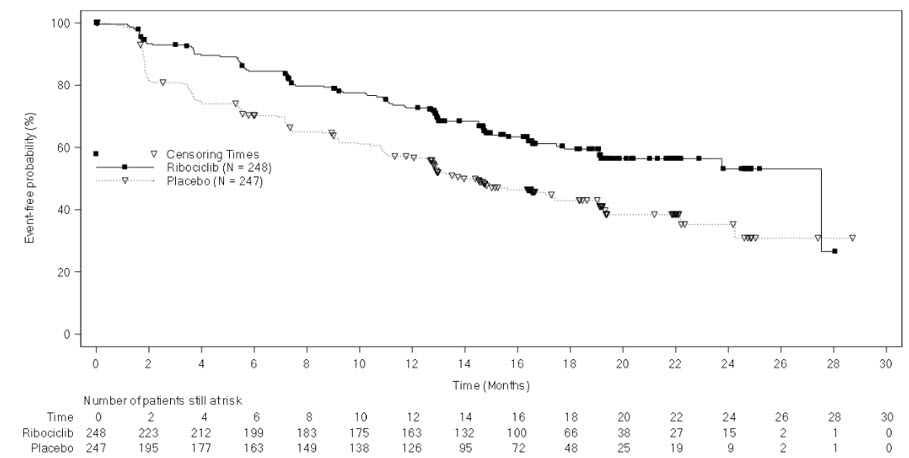
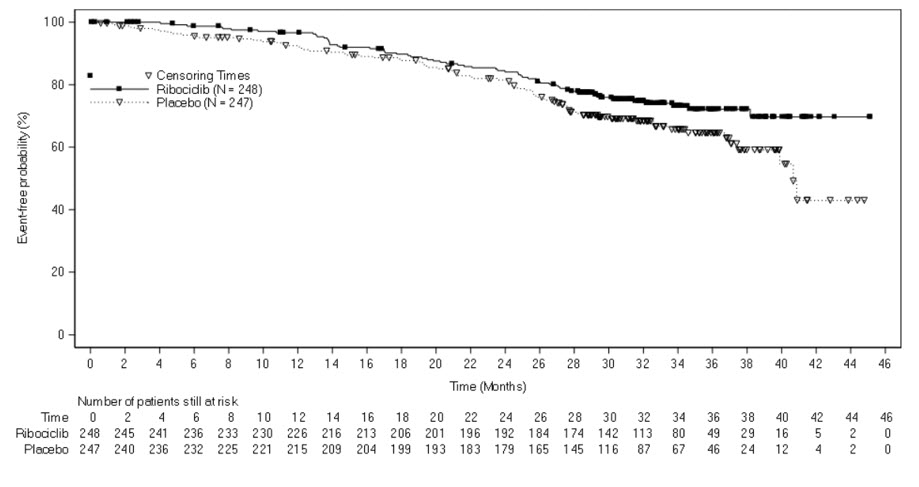
Figure 1 Kaplan-meier Progression Free Survival Curves – Monaleesa-2 (intent-to-treat Population) (Figure1)
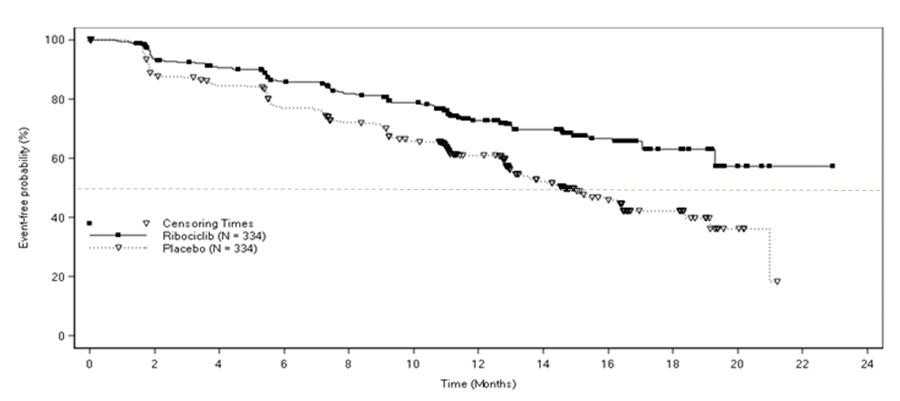
This chart shows the Eventree probability percentage (%) at various censoring times (in months) for 334 individuals taking Ribociclib and 334 individuals taking a placebo. The percentages are displayed at the intervals of 100, 60, 40, and 20.*