Everolimus Tablet
Product Images NDC 0093-7768

View Photos of Packaging, Regulatory Labels, and Product Appearance

Product Visual Gallery

This gallery contains 8 technical images submitted to the FDA as part of the official labeling for Everolimus (NDC 0093-7768). Unlike standard consumer photos, these assets often include clinical data figures, molecular chemical structures, and official manufacturer packaging layouts.

As provided by Teva Pharmaceuticals Usa, Inc., these visuals offer a comprehensive scientific overview of the product's physical and chemical identity, aiding pharmacists and researchers in product verification and study.

FDA Label Image

1 (Images 1)

1 (Images 1)
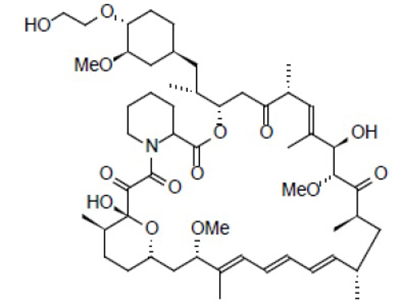
Chemical structure of Everolimus, an active pharmaceutical ingredient, showing its molecular framework with various functional groups including hydroxyl, methoxy, and carbonyl groups.*
FDA Label Image

2 (Images 2)

2 (Images 2)
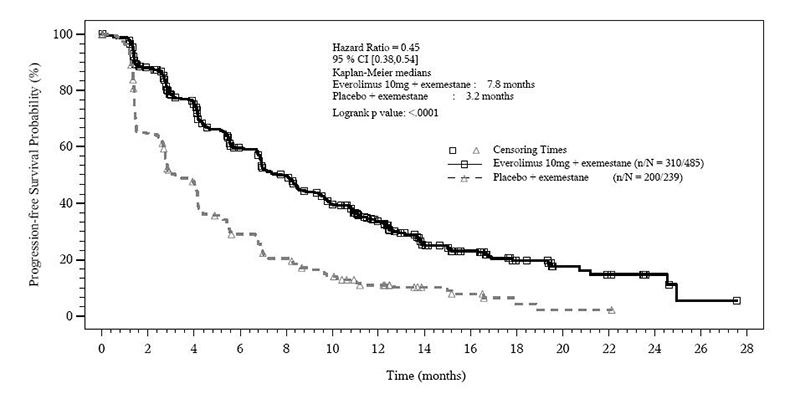
A Kaplan-Meier survival curve chart comparing progression-free survival probability over time (months) between Everolimus 10 mg plus exemestane and placebo plus exemestane in patients. The chart includes hazard ratio, confidence interval, median survival times, and log-rank p value, illustrating a higher survival probability for the Everolimus group.*
FDA Label Image

1 (Images 3)

1 (Images 3)
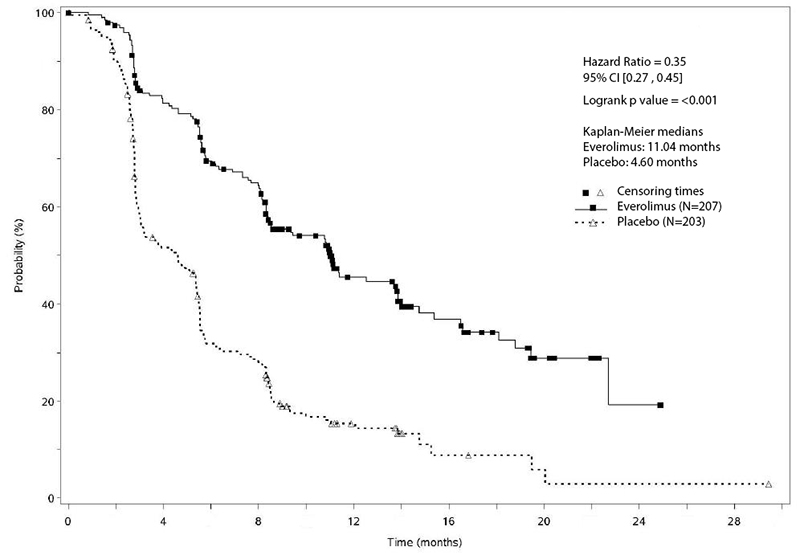
Kaplan-Meier survival curve chart comparing Everolimus and placebo groups over time in months with probability percentage on the y-axis. The chart includes hazard ratio, confidence interval, logrank p-value, median survival times, and censoring indicators for both groups.*
FDA Label Image

1 (Images 4)

1 (Images 4)
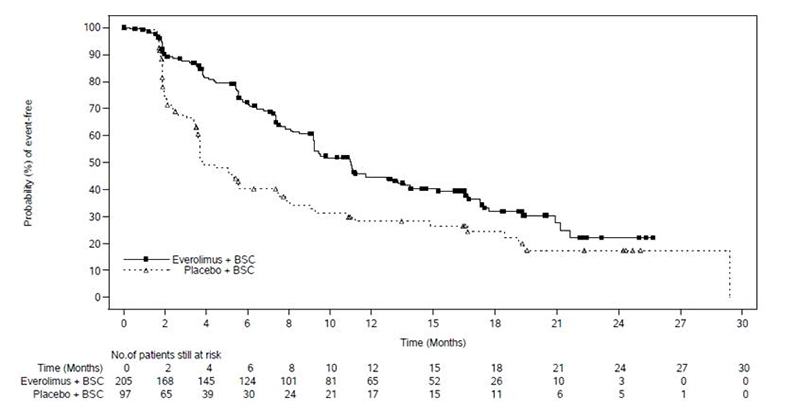
A Kaplan-Meier survival curve chart comparing the probability (%) of event-free patients over time (months) between Everolimus + BSC and Placebo + BSC groups. The chart includes data points and a risk table showing the number of patients still at risk at various time intervals up to 30 months.*
FDA Label Image

1 (Images 5)

1 (Images 5)
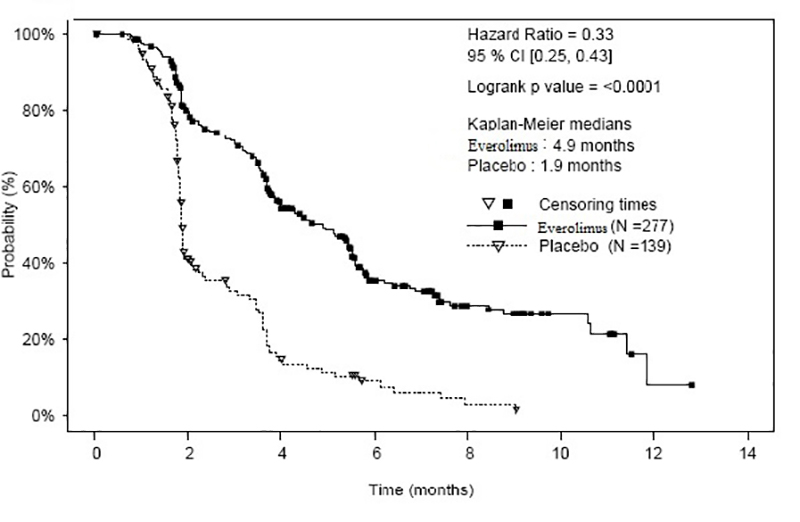
A Kaplan-Meier survival curve comparing Everolimus and placebo over time in months. The probability percentage is plotted on the Y-axis against time on the X-axis. The chart includes hazard ratio, confidence interval, p-value, median survival times for Everolimus (4.9 months) and placebo (1.9 months), and censoring times for the sample groups.*
FDA Label Image

2.5mg (Images 6)

2.5mg (Images 6)
Everolimus Tablets 2.5 mg oral tablet packaging label by Teva Pharmaceuticals USA, Inc. The label shows the product name, strength, NDC 0093-7766-24, quantity of 28 tablets, and manufacturer details including manufacturing in Croatia. Usage instructions and storage conditions are included, along with barcodes and lot/expiration placeholders.*
FDA Label Image

5mg (Images 7)

5mg (Images 7)
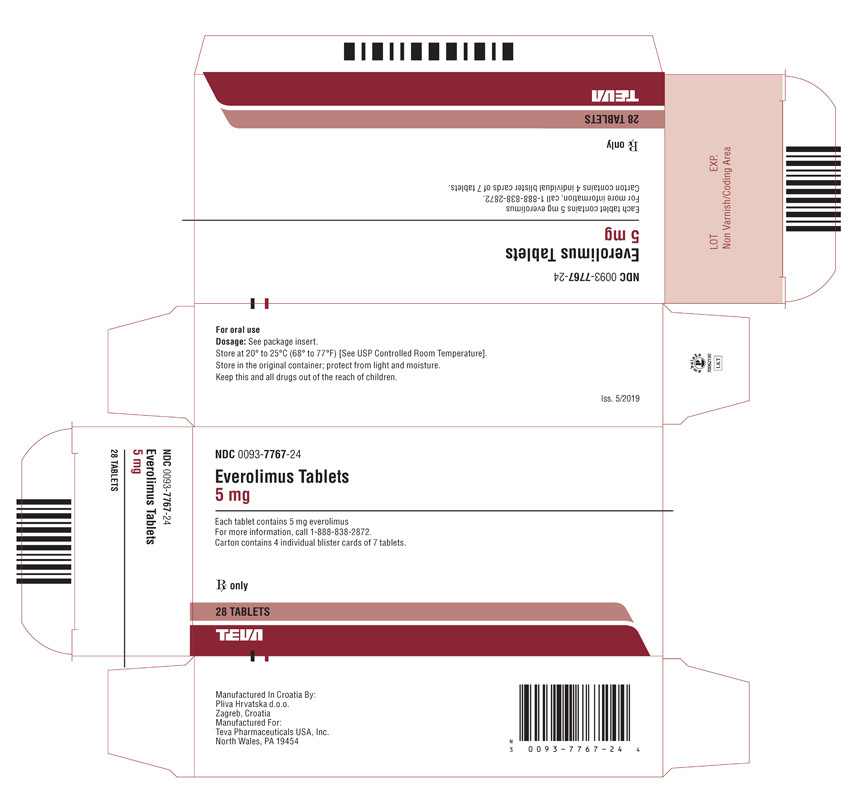
Everolimus Tablets 5 mg oral tablets carton label from Teva Pharmaceuticals USA, Inc. The label shows packaging for 28 tablets, with dosage instructions to see the package insert, storage conditions, and manufacturing details. The carton contains 4 individual blister cards of 7 tablets each, with a barcode and NDC 0093-7767-24 visible.*
FDA Label Image

7.5 mg (Images 8)

7.5 mg (Images 8)
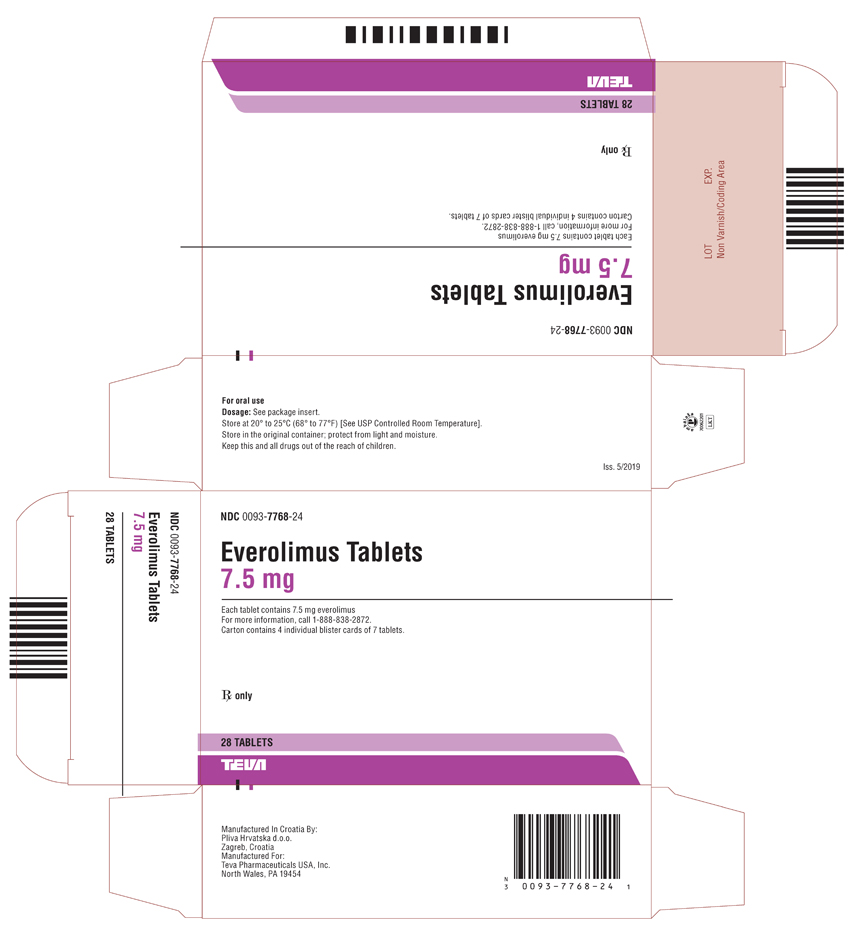
Packaging label for Everolimus Tablets 7.5 mg in oral tablet form by Teva Pharmaceuticals USA, Inc. The label states each tablet contains 7.5 mg everolimus and that the carton contains 28 tablets, arranged in 4 blister cards of 7 tablets. Storage instructions specify 20° to 25°C in the original container, protecting from light and moisture.*

* About these descriptions: Image descriptions on this page are generated by automated AI analysis of the product label images from the manufacturer's FDA label submission (SPL). They are provided for reference only and may contain errors or omissions. Always rely on the printed label itself and the official FDA labeling, and consult a pharmacist or healthcare professional with any questions about this product.