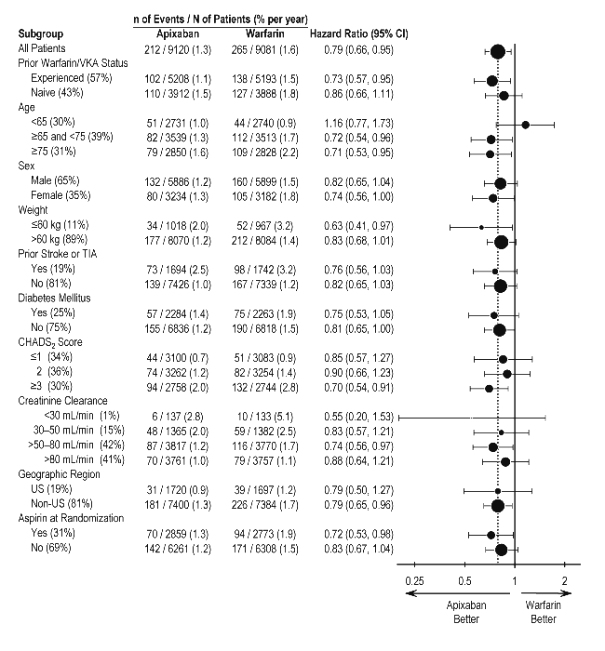
Aristotle Major Bleeding Forest Plot (Apixaban Tablets 1)
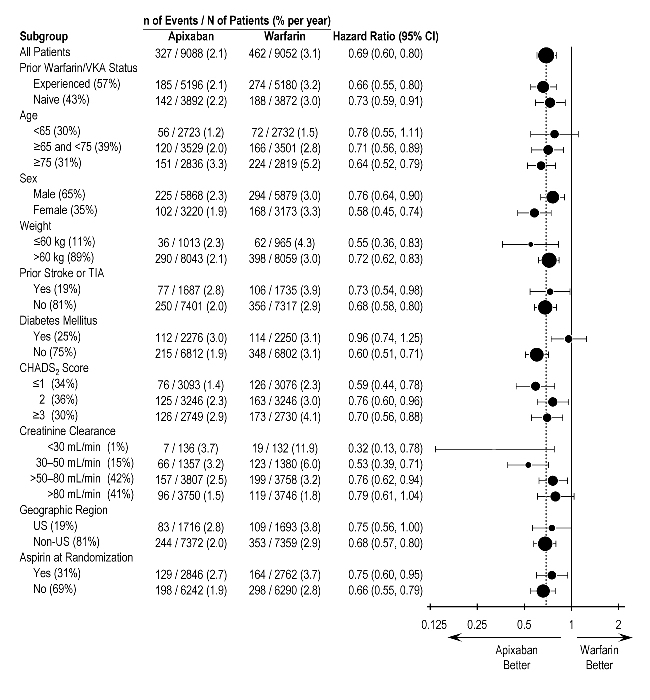
The provided text seems to be a table presenting data on different subgroups of patients who received Apixaban or Warfarin treatment. The table includes information such as the number of events, number of patients, percentage per year, hazard ratio, and confidence intervals for each subgroup. The data is categorized based on factors like age, sex, weight, prior stroke or TIA, diabetes mellitus, CHADS2 score, creatinine clearance, geographic region, and randomization status. The comparison between Apixaban and Warfarin effectiveness in different subgroups is also indicated in the table. Overall, this information can be used to evaluate the efficacy of Apixaban compared to Warfarin in various patient subgroups.*