Fulvestrant Injection
Product Images NDC 0143-9022

17 FDA label images from Hikma Pharmaceuticals Usa Inc. · Packaging, Regulatory Labels, and Product Appearance

Product Visual Gallery

This gallery contains 17 technical images submitted to the FDA as part of the official labeling for Fulvestrant (NDC 0143-9022). Unlike standard consumer photos, these assets often include clinical data figures, molecular chemical structures, and official manufacturer packaging layouts.

As provided by Hikma Pharmaceuticals Usa Inc., these visuals offer a comprehensive scientific overview of the product's physical and chemical identity, aiding pharmacists and researchers in product verification and study.

FDA Label Image

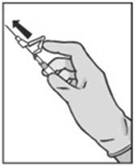
Figure1 (Fulvestrant Injection 1)

Figure1 (Fulvestrant Injection 1)
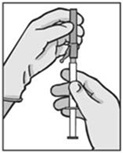
An instructional illustration showing a hand unscrewing or assembling parts of a medical syringe or injector device labeled with letters A, B, and C. The image demonstrates how to connect or prepare components, presumably related to the injection of Fulvestrant.*
FDA Label Image

Figure9 (Fulvestrant Injection 10)

Figure9 (Fulvestrant Injection 10)
A Kaplan-Meier progression-free survival curve comparing treatment with palbociclib plus fulvestrant versus placebo plus fulvestrant over 14 months. The plot shows progression-free survival probability over time in months, including a table indicating the number of patients at risk at different time points.*
FDA Label Image

Figure10 (Fulvestrant Injection 11)

Figure10 (Fulvestrant Injection 11)
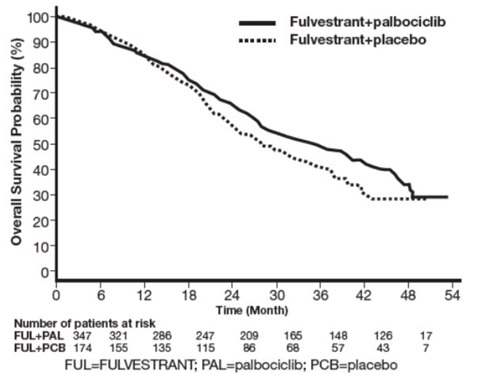
A survival probability curve chart comparing two treatment groups: Fulvestrant plus palbociclib versus Fulvestrant plus placebo. The y-axis shows Overall Survival Probability (%) from 0 to 100, and the x-axis shows Time in months from 0 to 54. The solid line represents Fulvestrant plus palbociclib, and the dotted line represents Fulvestrant plus placebo, with patient numbers at risk displayed below the x-axis at various time points.*
FDA Label Image

Figure11 (Fulvestrant Injection 12)

Figure11 (Fulvestrant Injection 12)
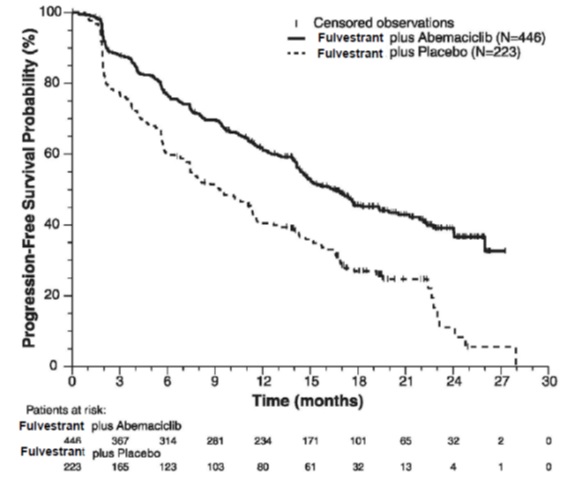
A Kaplan-Meier curve showing progression-free survival probability (%) over time (months) comparing Fulvestrant plus Abemaciclib (solid line, N=446) and Fulvestrant plus Placebo (dashed line, N=223). The chart includes censored observations and a table listing the number of patients at risk at various time points for each group.*
FDA Label Image

Figure12 (Fulvestrant Injection 13)

Figure12 (Fulvestrant Injection 13)
A survival probability chart comparing Fulvestrant plus Abemaciclib versus Fulvestrant plus Placebo over time in months. The y-axis represents survival probability (%) from 0 to 100, and the x-axis shows time in months from 0 to 57. The chart includes censored observations and patient counts at risk for each group at multiple time points.*
FDA Label Image

Figure13 (Fulvestrant Injection 14)

Figure13 (Fulvestrant Injection 14)
A Kaplan-Meier survival curve graph displaying event-free probability over time in months for two patient groups: Fulvestrant plus Ribociclib (484 patients) and Fulvestrant plus Placebo (242 patients). The graph includes censoring times and shows number of patients at risk at multiple time points up to 26 months.*
FDA Label Image

Figure14 (Fulvestrant Injection 15)

Figure14 (Fulvestrant Injection 15)
A Kaplan-Meier survival curve comparing event-free probability (%) over time (months) for two patient groups receiving Fulvestrant with either Ribociclib or placebo. The x-axis represents time in months up to 48, and the y-axis indicates event-free probability from 0 to 100%. Censoring times and number of patients at risk are shown for both groups.*
FDA Label Image

Hikma Syringe (Fulvestrant Injection 16)

Hikma Syringe (Fulvestrant Injection 16)
Fulvestrant Injection label for 50 mg/mL strength, packaged as 250 mg per 5 mL concentration. The label indicates it is for intramuscular use only and specifies protection from light. It includes barcodes, lot and expiration date fields, and distributor information for Hikma Pharmaceuticals USA Inc., Berkeley Heights, NJ.*
FDA Label Image

Fulvestrant Carton (Fulvestrant Injection 17)

Fulvestrant Carton (Fulvestrant Injection 17)
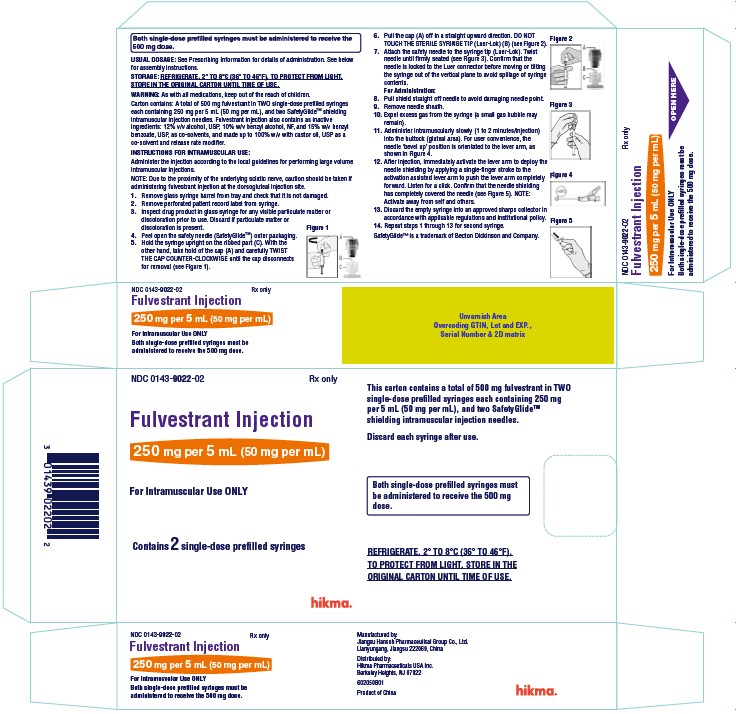
Fulvestrant Injection 250 mg per 5 mL (50 mg per mL) in single-dose prefilled syringes for intramuscular use only. The carton contains 2 prefilled syringes and 2 SafetyGlide shielding needles. Manufactured for Hikma Pharmaceuticals USA Inc. Instructions for use and storage conditions (refrigerate 2° to 8°C, protect from light) are also shown on the label.*
FDA Label Image

Figure2 (Fulvestrant Injection 2)

Figure2 (Fulvestrant Injection 2)
An instructional diagram showing the assembly and use of a syringe with a needle. The steps illustrate a hand attaching the needle by pushing and twisting it onto the syringe tip, demonstrating proper preparation for an intramuscular injection.*
FDA Label Image

Figure3 (Fulvestrant Injection 3)

Figure3 (Fulvestrant Injection 3)
An instructional illustration depicting a person holding a syringe and vial, demonstrating medication preparation or injection technique. The image shows gloved hands handling the syringe, indicating aseptic practice, applicable to intramuscular injection procedures.*
FDA Label Image

Figure4 (Fulvestrant Injection 4)

Figure4 (Fulvestrant Injection 4)
An instructional illustration showing the proper technique for drawing up a solution with a syringe and needle from a vial. The image highlights the angle and positioning for inserting the needle into the vial to withdraw medication.*
FDA Label Image

Figure5 (Fulvestrant Injection 5)

Figure5 (Fulvestrant Injection 5)
Black and white illustration of a hand holding a syringe with the plunger being pulled back, indicating preparation or drawing medication into the syringe.*
FDA Label Image

Structure (Fulvestrant Injection 6)

Structure (Fulvestrant Injection 6)
Chemical structure of Fulvestrant, showing its steroidal backbone with hydroxyl groups and a long sulfonyl side chain ending with trifluoromethyl groups.*
FDA Label Image

Figure6 (Fulvestrant Injection 7)

Figure6 (Fulvestrant Injection 7)
A Kaplan-Meier curve titled 'Progression Free Survival (ITT Population)' comparing Fulvestrant 250 mg and 500 mg doses. The y-axis shows the proportion of patients progression free, ranging from 0 to 1, and the x-axis shows time in months up to 45. The plot includes lines for both doses, with patient counts at risk presented below the x-axis over time.*
FDA Label Image

Figure7 (Fulvestrant Injection 8)

Figure7 (Fulvestrant Injection 8)
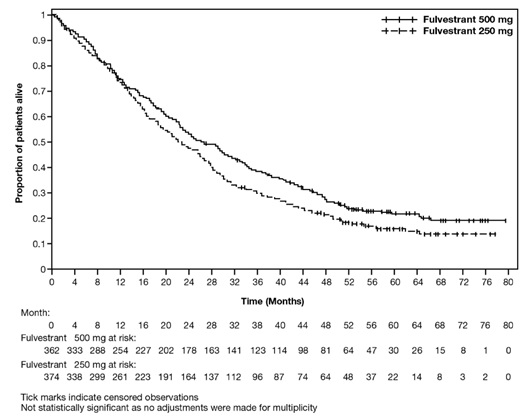
Kaplan-Meier survival curve comparing the proportion of patients alive over time (in months) for Fulvestrant 500 mg versus 250 mg doses. The x-axis shows time in months up to 80, and the y-axis shows the proportion of patients alive from 0 to 1. The graph includes censored observations tick marks and a table of patients at risk at various time points.*
FDA Label Image

Figure8 (Fulvestrant Injection 9)

Figure8 (Fulvestrant Injection 9)
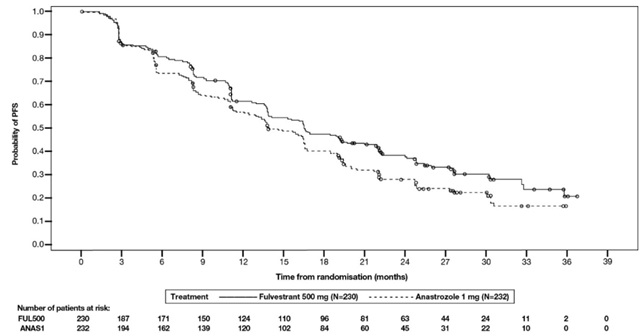
A Kaplan-Meier survival curve chart showing the probability of progression-free survival (PFS) over time in months. It compares treatment groups receiving Fulvestrant 500 mg (N=230) and Anastrozole 1 mg (N=232), with patient numbers at risk displayed below the x-axis for various time points up to 36 months.*

* About these descriptions: Image descriptions on this page are generated by automated AI analysis of the product label images from the manufacturer's FDA label submission (SPL). They are provided for reference only and may contain errors or omissions. Always rely on the printed label itself and the official FDA labeling, and consult a pharmacist or healthcare professional with any questions about this product.