Levemir Injection, Solution
Product Images NDC 0169-6432
View Photos of Packaging, Regulatory Labels, and Product Appearance
Product Visual Gallery
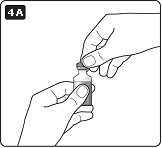
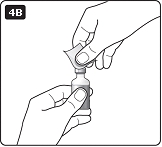
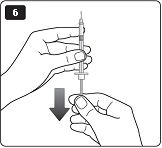
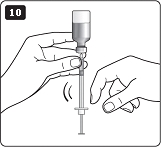
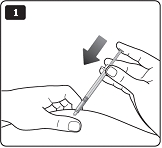
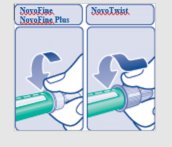
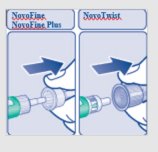
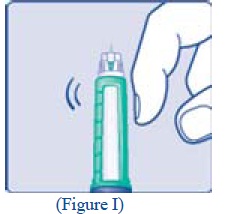
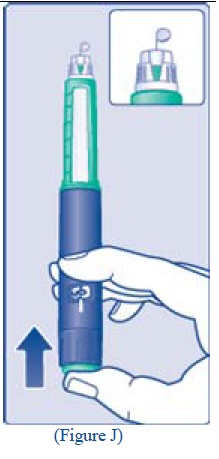
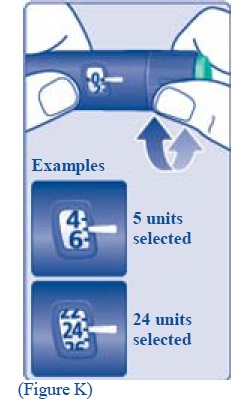
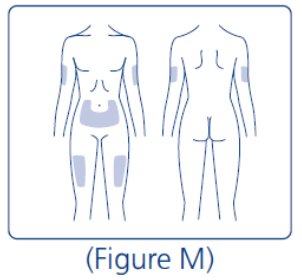
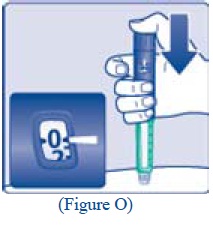
This gallery contains 35 technical images submitted to the FDA as part of the official labeling for Levemir (NDC 0169-6432). Unlike standard consumer photos, these assets often include clinical data figures, molecular chemical structures, and official manufacturer packaging layouts.
As provided by Novo Nordisk, these visuals offer a comprehensive scientific overview of the product's physical and chemical identity, aiding pharmacists and researchers in product verification and study.
Product Images & Figures Index
Figure 4a (Aa947266 E27c 432b 8e04 C36168d24ddb 06)
Figure 4b (Aa947266 E27c 432b 8e04 C36168d24ddb 07)
Figure 6 (Aa947266 E27c 432b 8e04 C36168d24ddb 08)
Figure 7 (Aa947266 E27c 432b 8e04 C36168d24ddb 09)
Figure 8 (Aa947266 E27c 432b 8e04 C36168d24ddb 10)
Figure 9 (Aa947266 E27c 432b 8e04 C36168d24ddb 11)
Figure 10 (Aa947266 E27c 432b 8e04 C36168d24ddb 12)
Figure 1 (Aa947266 E27c 432b 8e04 C36168d24ddb 13)
Step 1 Fig B.jpg (Aa947266 E27c 432b 8e04 C36168d24ddb 28)
Step 2 Fig C.jpg (Aa947266 E27c 432b 8e04 C36168d24ddb 29)
Figure D (Aa947266 E27c 432b 8e04 C36168d24ddb 30)
Figure E (Aa947266 E27c 432b 8e04 C36168d24ddb 31)
Figure F (Aa947266 E27c 432b 8e04 C36168d24ddb 32)
Figure G (Aa947266 E27c 432b 8e04 C36168d24ddb 33)
Step 7 Fig H.jpg (Aa947266 E27c 432b 8e04 C36168d24ddb 34)
Step 8 Fig I.jpg (Aa947266 E27c 432b 8e04 C36168d24ddb 35)
Step 9 Fig J.jpg (Aa947266 E27c 432b 8e04 C36168d24ddb 36)
Step 10 Fig K.jpg (Aa947266 E27c 432b 8e04 C36168d24ddb 37)
Step 10 Fig L (Aa947266 E27c 432b 8e04 C36168d24ddb 38)
Step 11 Fig M (Aa947266 E27c 432b 8e04 C36168d24ddb 39)
Step 12 Fig N.jpg (Aa947266 E27c 432b 8e04 C36168d24ddb 40)
Step 13 Fig O.jpg (Aa947266 E27c 432b 8e04 C36168d24ddb 41)
Step 13 Fig P.jpg (Aa947266 E27c 432b 8e04 C36168d24ddb 42)
Step 14 Fig Q.jpg (Aa947266 E27c 432b 8e04 C36168d24ddb 43)
Step 15 Fig S.jpg (Aa947266 E27c 432b 8e04 C36168d24ddb 45)
Step 16 Fig T.jpg (Aa947266 E27c 432b 8e04 C36168d24ddb 46)
Flextouch Qr Code (Aa947266 E27c 432b 8e04 C36168d24ddb 50)
Image Of Levemir Vial Carton (Image 01)
Flextouch (Image 02)
Needle Components. (Image 03)
Figure A Flextouch Pen Components. (Image 04)
Step 15 Figure R (Image 05)
Figure 2: Activity Profiles In Patients With Type 1 Diabetes (Image 06)
The text seems to be a graph showing pharmacodynamic parameters for Levemir, with glucose infusion rate and time since insulin injection on the x-axis and y-axis respectively. The graph is divided into two lines, one for 0.2 Units/kg dose and the other for 0.4 Units/kg dose. The graph also shows the area under the curve for glucose infusion rate and the maximum glucose infusion rate.*
Figure 3: Activity Profiles In Patients With Type 2 Diabetes (Image 07)
This is a chart showing pharmacodynamic parameters for Levemir, a drug used to treat diabetes. The chart displays the Glucose Infusion Rate (mg/kg/min) over time since insulin injection (hours) for two different doses of Levemir (0.6 Units/kg and 1.2 Units/kg). The graph also includes two pharmacodynamic parameters: AUCa or Area Under Curve Glucose Infusion Rate and GIRmax or Maximum Glucose Infusion Rate.*
* These product label images have been analyzed using experimental machine learning. Please verify findings with the primary label text.