Anoro Ellipta Powder
Product Images NDC 0173-0869

23 FDA label images from Glaxosmithkline Llc · Packaging, Regulatory Labels, and Product Appearance

Product Visual Gallery

This gallery contains 23 technical images submitted to the FDA as part of the official labeling for Anoro Ellipta (NDC 0173-0869). Unlike standard consumer photos, these assets often include clinical data figures, molecular chemical structures, and official manufacturer packaging layouts.

As provided by Glaxosmithkline Llc, these visuals offer a comprehensive scientific overview of the product's physical and chemical identity, aiding pharmacists and researchers in product verification and study.

FDA Label Image

Umeclidinium Bromide Chemical Structure (Anoro Ellipta Spl Graphic 01)

Umeclidinium Bromide Chemical Structure (Anoro Ellipta Spl Graphic 01)
Chemical structure of umeclidinium bromide, one of the active ingredients in Anoro Ellipta. The diagram depicts its molecular configuration with aromatic rings and functional groups as part of the inhalation powder formulation by GlaxoSmithKline LLC.*
FDA Label Image

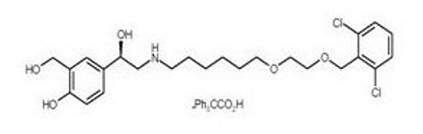
Vilanterol Trifenatate Chemical Structure (Anoro Ellipta Spl Graphic 02)

Vilanterol Trifenatate Chemical Structure (Anoro Ellipta Spl Graphic 02)
Chemical structure diagram showing the molecular composition labeled as umeclidinium bromide and vilanterol trifenatate, the active ingredients in Anoro Ellipta inhalation powder. The structure displays atoms and bonds including rings and functional groups typical for these compounds.*
FDA Label Image

Figure 1. Impact Of Intrinsic Factors On The Pharmacokinetics (pk) Of Umeclidinium (umec) And Vilanterol (vi) (Anoro Ellipta Spl Graphic 03)

Figure 1. Impact Of Intrinsic Factors On The Pharmacokinetics (pk) Of Umeclidinium (umec) And Vilanterol (vi) (Anoro Ellipta Spl Graphic 03)
A figure showing pharmacokinetic fold changes with 90% confidence intervals for umeclidinium bromide (UMEC) and vilanterol trifenatate (VI) in various populations including male gender, age above 65 years, severe renal impairment, moderate hepatic impairment, and CYP2D6 poor metabolizers, with corresponding dosage adjustment recommendations indicating no dose adjustment needed.*
FDA Label Image

Figure 2. Impact Of Extrinsic Factors On The Pharmacokinetics (pk) Of Umeclidinium (umec) And Vilanterol (vi) (Anoro Ellipta Spl Graphic 04)

Figure 2. Impact Of Extrinsic Factors On The Pharmacokinetics (pk) Of Umeclidinium (umec) And Vilanterol (vi) (Anoro Ellipta Spl Graphic 04)
A chart showing the pharmacokinetic effects of interacting drugs verapamil and ketoconazole on umeclidinium bromide (UMEC) and vilanterol trifenatate (VI). It depicts fold changes and 90% confidence intervals in AUC and Cmax relative to reference values, with dosing recommendations indicated as no dose adjustment or caution.*
FDA Label Image

Figure 3. Least Squares (ls) Mean Change From Baseline In Postdose Serial Fev1 (ml) On Days 1 And 7, Day 1 (Anoro Ellipta Spl Graphic 05)

Figure 3. Least Squares (ls) Mean Change From Baseline In Postdose Serial Fev1 (ml) On Days 1 And 7, Day 1 (Anoro Ellipta Spl Graphic 05)
Line chart showing least squares mean change from baseline in milliliters (mL) over 6 hours after inhalation. The x-axis is time in hours, and the y-axis is the volume change. Four doses of umeclidinium (15.6 mcg, 31.25 mcg, 62.5 mcg, and 125 mcg) and placebo are plotted, each represented by distinct markers. The graph depicts changes in lung function or volume compared to baseline across different doses and time points.*
FDA Label Image

Figure 3. Least Squares (ls) Mean Change From Baseline In Postdose Serial Fev1 (ml) On Days 1 And 7, Day 7 (Anoro Ellipta Spl Graphic 06)

Figure 3. Least Squares (ls) Mean Change From Baseline In Postdose Serial Fev1 (ml) On Days 1 And 7, Day 7 (Anoro Ellipta Spl Graphic 06)
A line graph showing the least squares mean change from baseline in mL over a 24-hour period for different doses of umeclidinium (15.6 mcg, 31.25 mcg, 62.5 mcg, and 125 mcg) compared to placebo. The x-axis represents time in hours, and the y-axis represents change in mL. Multiple dose groups exhibit varying levels of increase from baseline, with placebo showing a decline over time.*
FDA Label Image

Figure 4. Least Squares (ls) Mean Change From Baseline In Postdose Serial Fev1 (0-24 H) (ml) On Days 1 And 28, Day 1 (Anoro Ellipta Spl Graphic 07)

Figure 4. Least Squares (ls) Mean Change From Baseline In Postdose Serial Fev1 (0-24 H) (ml) On Days 1 And 28, Day 1 (Anoro Ellipta Spl Graphic 07)
A line graph showing the LS mean change from baseline in mL over 24 hours for different doses of vilanterol (3.0 mcg to 50 mcg) compared to placebo. The x-axis represents time in hours, and the y-axis represents LS mean change from baseline in mL. Multiple dose-response curves illustrate lung function changes over time, with higher doses generally showing greater increases.*
FDA Label Image

Figure 4. Least Squares (ls) Mean Change From Baseline In Postdose Serial Fev1 (0-24 H) (ml) On Days 1 And 28, Day 28 (Anoro Ellipta Spl Graphic 08)

Figure 4. Least Squares (ls) Mean Change From Baseline In Postdose Serial Fev1 (0-24 H) (ml) On Days 1 And 28, Day 28 (Anoro Ellipta Spl Graphic 08)
A line graph depicting the least squares (LS) mean change from baseline in milliliters over 24 hours for various doses of vilanterol compared to placebo. The x-axis shows time points in hours, and the y-axis shows LS mean change from baseline in mL. Multiple lines represent placebo and vilanterol doses of 3.0 mcg, 6.25 mcg, 12.5 mcg, 25 mcg, and 50 mcg.*
FDA Label Image

Figure 5. Least Squares (ls) Mean Change From Baseline In Fev1 (ml) Over Time (0-24 H) On Days 1 And 168 (trial 1 Subset Population), Day 1 (Anoro Ellipta Spl Graphic 09)

Figure 5. Least Squares (ls) Mean Change From Baseline In Fev1 (ml) Over Time (0-24 H) On Days 1 And 168 (trial 1 Subset Population), Day 1 (Anoro Ellipta Spl Graphic 09)
A line graph showing the least squares mean change from baseline in mL over time (hours) for four treatments: Placebo, Vilanterol 25 mcg, Umeclidinium 62.5 mcg, and Umeclidinium 62.5 mcg/Vilanterol 25 mcg. The x-axis represents time from 0.25 to 24 hours, and the y-axis represents LS mean change in mL from baseline, ranging approximately from -250 to 400 mL.*
FDA Label Image

Figure 5. Least Squares (ls) Mean Change From Baseline In Fev1 (ml) Over Time (0-24 H) On Days 1 And 168 (trial 1 Subset Population), Day 168 (Anoro Ellipta Spl Graphic 10)

Figure 5. Least Squares (ls) Mean Change From Baseline In Fev1 (ml) Over Time (0-24 H) On Days 1 And 168 (trial 1 Subset Population), Day 168 (Anoro Ellipta Spl Graphic 10)
A line graph showing the least squares mean change from baseline in milliliters (mL) over 24 hours for multiple treatment groups: placebo, umeclidinium 62.5 mcg, vilanterol 25 mcg, and umeclidinium 62.5 mcg/vilanterol 25 mcg. The x-axis represents time in hours, and the y-axis shows changes in mL. Different symbols represent each treatment group with values plotted over time.*
FDA Label Image

Inhaler Parts Figure (Anoro Ellipta Spl Graphic 11)

Inhaler Parts Figure (Anoro Ellipta Spl Graphic 11)
An instructional diagram showing components of the Anoro Ellipta inhaler packaging, including the carton, tray, tray lid, inhaler, desiccant packet, and patient information leaflet, all labeled and displayed separately.*
FDA Label Image

Figure A (Anoro Ellipta Spl Graphic 12)

Figure A (Anoro Ellipta Spl Graphic 12)
An instructional illustration demonstrating a hand peeling back the foil seal of a blister pack containing a respiratory inhalation powder device for Anoro Ellipta. The image shows the initial step in accessing the powder device for use.*
FDA Label Image

Figure B (Anoro Ellipta Spl Graphic 13)

Figure B (Anoro Ellipta Spl Graphic 13)
An instructional illustration showing a hand discarding a packet containing pills into an open trash can with a detached lid leaning against it.*
FDA Label Image

Figure C (Anoro Ellipta Spl Graphic 14)

Figure C (Anoro Ellipta Spl Graphic 14)
An instructional diagram of the Anoro Ellipta inhaler device showing its cover and dose counter. The inhaler's shape is depicted with a labeled cover at the top and a counter window displaying the number 30 on its body, indicating remaining doses.*
FDA Label Image

Figure D (Anoro Ellipta Spl Graphic 15)

Figure D (Anoro Ellipta Spl Graphic 15)
An instructional diagram of the Anoro Ellipta inhaler showing a hand opening the cover near the mouthpiece. The illustration labels the mouthpiece, air vent, counter displaying the number 29, and cover, indicating the "click" sound when opening the device for use.*
FDA Label Image

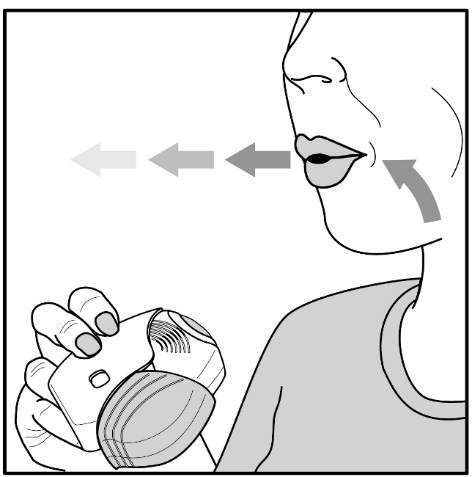
Figure E (Anoro Ellipta Spl Graphic 16)

Figure E (Anoro Ellipta Spl Graphic 16)
An instructional line drawing showing a person using an inhaler device. The person holds the inhaler near their mouth and is depicted exhaling or breathing out, indicated by arrows pointing away from the mouth.*
FDA Label Image

Figure F (Anoro Ellipta Spl Graphic 17)

Figure F (Anoro Ellipta Spl Graphic 17)
An instructional line drawing showing a person holding an inhaler device close to their mouth, demonstrating how to position the mouthpiece for respiratory inhalation of powdered medication.*
FDA Label Image

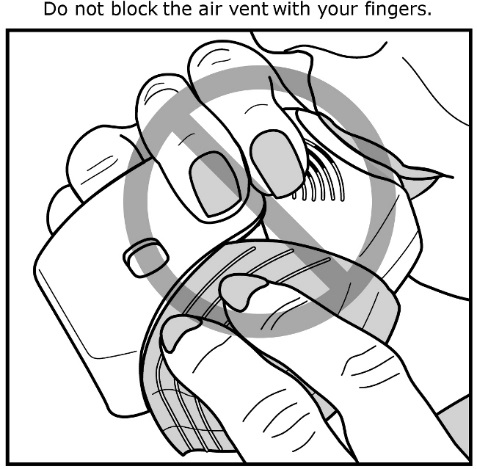
Figure G (Anoro Ellipta Spl Graphic 18)

Figure G (Anoro Ellipta Spl Graphic 18)
Instructional illustration showing a person holding the Anoro Ellipta inhaler with one hand while pulling a cover with the other hand, demonstrating proper handling technique. Text above the image advises not to block the air vent with fingers.*
FDA Label Image

Figure H (Anoro Ellipta Spl Graphic 19)

Figure H (Anoro Ellipta Spl Graphic 19)
An instructional illustration showing a person preparing for inhalation, with text indicating to hold breath for 3-4 seconds after using the inhaler. The image emphasizes the importance of breath-holding timing during respiratory medication administration.*
FDA Label Image

Figure I (Anoro Ellipta Spl Graphic 20)

Figure I (Anoro Ellipta Spl Graphic 20)
Instructional illustration showing a person using the Anoro Ellipta inhaler by placing the device close to their mouth and blowing air outward, indicating the direction to exhale before inhalation. The image visually guides proper respiratory inhalation technique for the powder formulation.*
FDA Label Image

Figure J (Anoro Ellipta Spl Graphic 21)

Figure J (Anoro Ellipta Spl Graphic 21)
An instructional illustration showing the Anoro Ellipta inhaler device with its cover partially opened, indicated by an upward-curved arrow. The device includes a dose counter displaying the number 29, used for respiratory powder inhalation of umeclidinium bromide and vilanterol trifenatate.*
FDA Label Image

Figure K (Anoro Ellipta Spl Graphic 22)

Figure K (Anoro Ellipta Spl Graphic 22)
An instructional diagram of a respiratory inhaler device, labeled with color coding. The device is shown in a side view with an arrow pointing to a window or indicator area marked as "Red." The illustration highlights the design and functional part of the inhaler related to color indication.*
FDA Label Image

Anoro Ellipta 30 Dose Carton (Anoro Ellipta Spl Graphic 23)

Anoro Ellipta 30 Dose Carton (Anoro Ellipta Spl Graphic 23)
Anoro Ellipta inhalation powder 62.5 mcg/25 mcg for oral inhalation only. The label features the product name, active ingredients umeclidinium and vilanterol, and dosage strength. It includes a depiction of the Ellipta inhaler device, which contains 30 doses (60 blisters total). Labeler is GlaxoSmithKline LLC, and the product NDC is 0173-0869-10.*

* About these descriptions: Image descriptions on this page are generated by automated AI analysis of the product label images from the manufacturer's FDA label submission (SPL). They are provided for reference only and may contain errors or omissions. Always rely on the printed label itself and the official FDA labeling, and consult a pharmacist or healthcare professional with any questions about this product.