Trelegy Ellipta Powder
Product Images NDC 0173-0893
Product Visual Gallery
This gallery contains 27 technical images submitted to the FDA as part of the official labeling for Trelegy Ellipta (NDC 0173-0893). Unlike standard consumer photos, these assets often include clinical data figures, molecular chemical structures, and official manufacturer packaging layouts.
As provided by Glaxosmithkline Llc, these visuals offer a comprehensive scientific overview of the product's physical and chemical identity, aiding pharmacists and researchers in product verification and study.
Product Images & Figures Index
Umeclidinium Chemical Structure (Trelegy Ellipta Spl Graphic 02)
Vilanterol Chemical Structure (Trelegy Ellipta Spl Graphic 03)
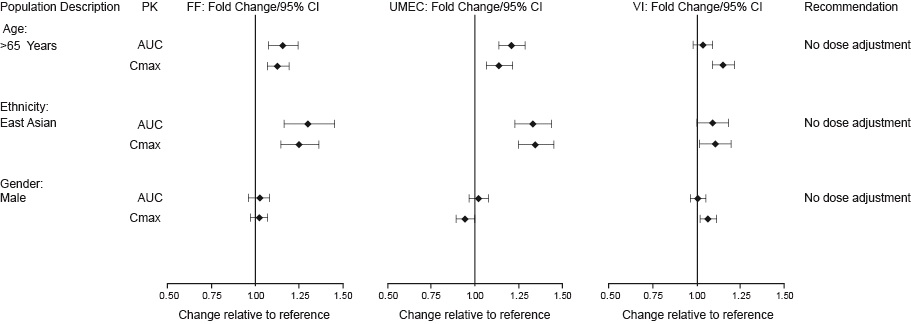
Figure 1. Impact Of Intrinsic Factors On The Pharmacokinetics (pk) Of Fluticasone Furoate (ff), Umeclidinium (umec), And Vilanterol (vi) Following Coadministration (Trelegy Ellipta Spl Graphic 04)
Figure 2. Impact Of Intrinsic Factors On The Pharmacokinetics (pk) Of Fluticasone Furoate (ff), Umeclidinium (umec), And Vilanterol (vi) Following Coadministration In Asthmaa (Trelegy Ellipta Spl Graphic 05)
Figure 3. Impact Of Intrinsic Factorsa And Coadministered Drugsb On The Pharmacokinetics (pk) Of Fluticasone Furoate (ff) And Vilanterol (vi) Following Administration As Fluticasone Furoate/vilanterol Combination Or Following Vilanterol Coadministered With Umeclidinium (Trelegy Ellipta Spl Graphic 06)
Figure 4. Impact Of Intrinsic Factors And Coadministered Drugs On The Systemic Exposure Of Umeclidinium (Trelegy Ellipta Spl Graphic 07)
Figure 5. Least Squares (ls) Mean Change From Baseline In Postdose Serial Fev1 (ml) On Day 1 (Trelegy Ellipta Spl Graphic 08)
Figure 6. Least Squares (ls) Mean Change From Baseline In Postdose Serial Fev1 (ml) On Day 84 (Trelegy Ellipta Spl Graphic 09)
Figure 7. Least Squares (ls) Mean Change From Baseline In Trough Fev1 (ml) (Trelegy Ellipta Spl Graphic 10)
Figure 8. Least Squares Mean Change From Baseline In Trough Fev1 (ml) With Trelegy Ellipta 100/62.5/25 Mcg Over 24 Weeks Of Treatment (Trelegy Ellipta Spl Graphic 11)
Figure 9. Least Squares Mean Change From Baseline In Trough Fev1 (ml) With Trelegy Ellipta 200/62.5/25 Mcg Over 24 Weeks Of Treatment (Trelegy Ellipta Spl Graphic 12)
Trelegy Ellipta Inhaler (Trelegy Ellipta Spl Graphic 13)
Figure A (Trelegy Ellipta Spl Graphic 14)
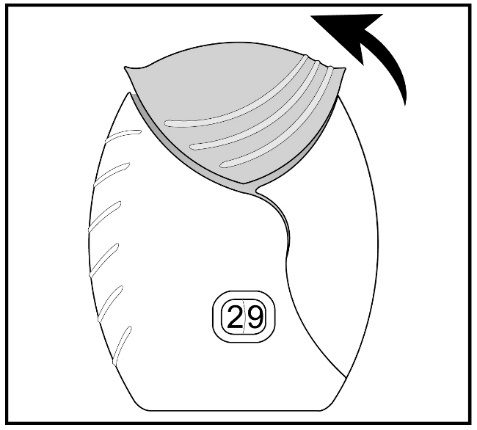
Figure B (Trelegy Ellipta Spl Graphic 15)
Figure C (Trelegy Ellipta Spl Graphic 16)
Figure D (Trelegy Ellipta Spl Graphic 17)
Figure E (Trelegy Ellipta Spl Graphic 18)
Figure F (Trelegy Ellipta Spl Graphic 19)
Figure G (Trelegy Ellipta Spl Graphic 20)
Figure H (Trelegy Ellipta Spl Graphic 21)
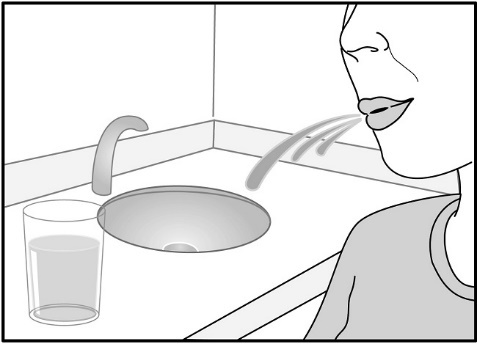
Figure I (Trelegy Ellipta Spl Graphic 22)
Figure J (Trelegy Ellipta Spl Graphic 23)
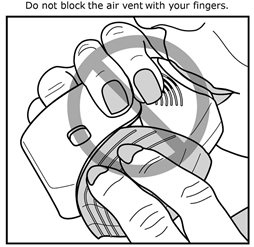
Figure K (Trelegy Ellipta Spl Graphic 24)
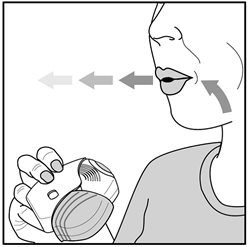
Figure L (Trelegy Ellipta Spl Graphic 25)
Trelegy Ellipta 100mcg-62.5mcg-25mcg 30 Dose Carton (Trelegy Ellipta Spl Graphic 26)
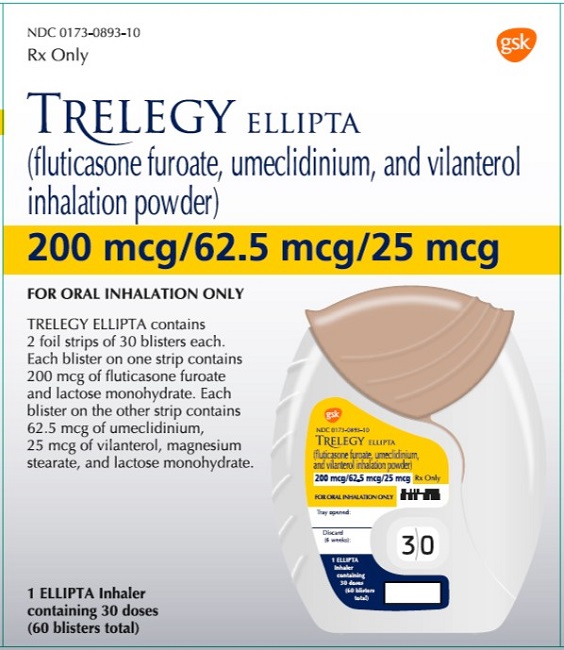
Trelegy Ellipta 200mcg-62.5mcg-25mcg 30 Dose Carton (Trelegy Ellipta Spl Graphic 27)
* About these descriptions: Image descriptions on this page are generated by automated AI analysis of the product label images from the manufacturer's FDA label submission (SPL). They are provided for reference only and may contain errors or omissions. Always rely on the printed label itself and the official FDA labeling, and consult a pharmacist or healthcare professional with any questions about this product.