Breo Ellipta Powder
Product Images NDC 0173-0916

27 FDA label images from Glaxosmithkline Llc · Packaging, Regulatory Labels, and Product Appearance

Product Visual Gallery

This gallery contains 27 technical images submitted to the FDA as part of the official labeling for Breo Ellipta (NDC 0173-0916). Unlike standard consumer photos, these assets often include clinical data figures, molecular chemical structures, and official manufacturer packaging layouts.

As provided by Glaxosmithkline Llc, these visuals offer a comprehensive scientific overview of the product's physical and chemical identity, aiding pharmacists and researchers in product verification and study.

FDA Label Image

Fluticasone Furoate Chemical Structure (Breo Ellipta Spl Graphic 01)
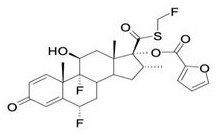
Fluticasone Furoate Chemical Structure (Breo Ellipta Spl Graphic 01)
Chemical structure diagram of fluticasone furoate, one of the active ingredients in Breo Ellipta. The image depicts the molecular layout including fluorine, oxygen, and sulfur atoms within the steroid framework.*
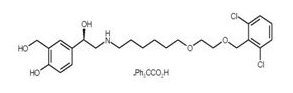
FDA Label Image

Vilanterol Trifenatate Chemical Structure (Breo Ellipta Spl Graphic 02)

Vilanterol Trifenatate Chemical Structure (Breo Ellipta Spl Graphic 02)
Chemical structure of fluticasone furoate, the active ingredient in Breo Ellipta. The diagram shows the molecular arrangement including hydroxyl groups, chlorine atoms, and aromatic rings as part of the compound's chemical framework.*
FDA Label Image

Figure 1. Impact Of Intrinsic Factors On The Pharmacokinetics (pk) Of Fluticasone Furoate (ff) And Vilanterol (vi) Following Administration As Fluticasone Furoate/vilanterol Combination (Breo Ellipta Spl Graphic 03)

Figure 1. Impact Of Intrinsic Factors On The Pharmacokinetics (pk) Of Fluticasone Furoate (ff) And Vilanterol (vi) Following Administration As Fluticasone Furoate/vilanterol Combination (Breo Ellipta Spl Graphic 03)
A chart depicting pharmacokinetic fold changes and 90% confidence intervals for fluticasone furoate (FF) and vilanterol trifenatate (VI) in various populations, including severe renal impairment, hepatic impairment, COPD patients over 65, ethnicity (East Asian), gender (male), and asthma patients over 65. The graph shows changes relative to reference values along with dosing recommendations like no dose adjustment or caution.*
FDA Label Image

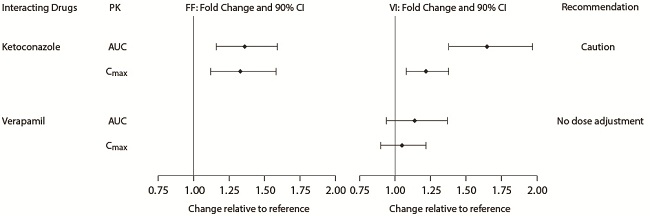
Figure 2. Impact Of Coadministered Drugsa On The Pharmacokinetics (pk) Of Fluticasone Furoate (ff) And Vilanterol (vi) Following Administration As Fluticasone Furoate/vilanterol Combination Or Vilanterol Coadministered With A Long-acting Muscarinic Antagonist (Breo Ellipta Spl Graphic 04)

Figure 2. Impact Of Coadministered Drugsa On The Pharmacokinetics (pk) Of Fluticasone Furoate (ff) And Vilanterol (vi) Following Administration As Fluticasone Furoate/vilanterol Combination Or Vilanterol Coadministered With A Long-acting Muscarinic Antagonist (Breo Ellipta Spl Graphic 04)
A pharmacokinetic chart showing fold change and 90% confidence intervals for pharmacokinetic parameters (AUC and Cmax) of fluticasone furoate and vilanterol trifenatate when administered with interacting drugs ketoconazole and verapamil. The x-axis represents change relative to reference, and recommendations of caution or no dose adjustment are included.*
FDA Label Image

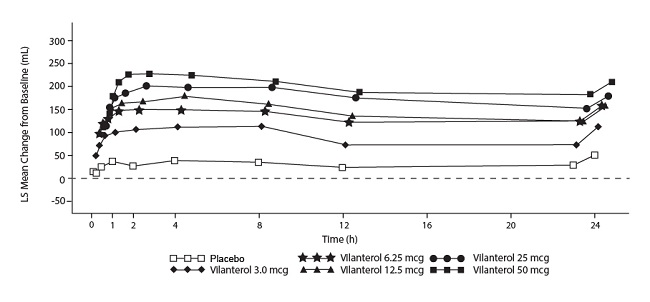
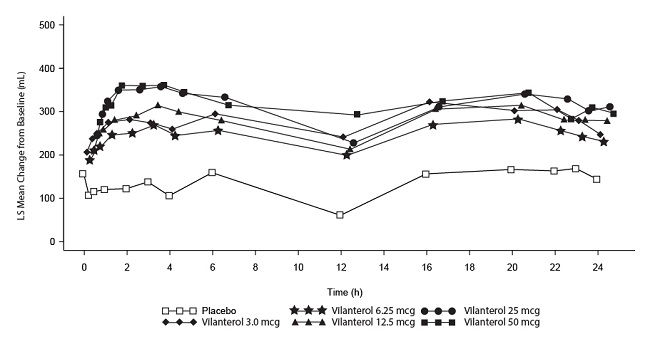
Figure 3. Least Squares (ls) Mean Change From Baseline In Postdose Serial Fev1 (0-24 H) (ml) On Days 1 And 28, Day 1 (Breo Ellipta Spl Graphic 05)

Figure 3. Least Squares (ls) Mean Change From Baseline In Postdose Serial Fev1 (0-24 H) (ml) On Days 1 And 28, Day 1 (Breo Ellipta Spl Graphic 05)
Line graph showing least squares (LS) mean change in a volume measurement (mL) over time (hours) comparing placebo to various doses of vilanterol (3.0 mcg, 6.25 mcg, 12.5 mcg, 25 mcg, and 50 mcg). The data illustrate a dose-response effect, with higher doses of vilanterol generally showing greater volume changes compared to placebo over a 24-hour period.*
FDA Label Image

Figure 3. Least Squares (ls) Mean Change From Baseline In Postdose Serial Fev1 (0-24 H) (ml) On Days 1 And 28, Day 28 (Breo Ellipta Spl Graphic 06)

Figure 3. Least Squares (ls) Mean Change From Baseline In Postdose Serial Fev1 (0-24 H) (ml) On Days 1 And 28, Day 28 (Breo Ellipta Spl Graphic 06)
A line graph showing the least squares (LS) mean change from baseline in milliliters (mL) over 24 hours. The x-axis represents time in hours, while the y-axis shows LS mean change. The graph compares placebo with multiple doses of vilanterol (3.0 mcg, 6.25 mcg, 12.5 mcg, 25 mcg, and 50 mcg), illustrating dose-dependent changes over time.*
FDA Label Image

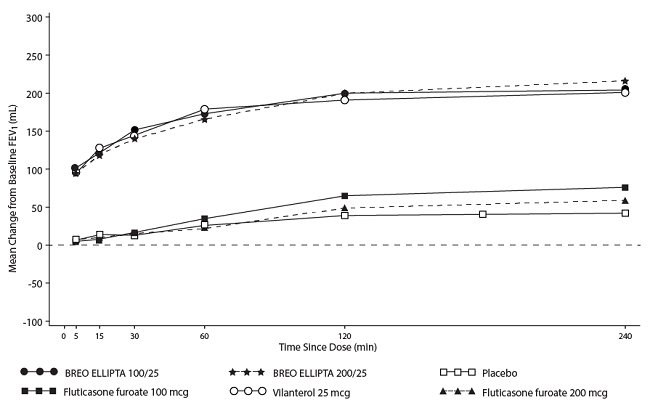
Figure 4. Raw Mean Change From Baseline In Postdose Serial Fev1 (0-4 H) (ml) On Days 1 And 168, Day 1 (Breo Ellipta Spl Graphic 07)

Figure 4. Raw Mean Change From Baseline In Postdose Serial Fev1 (0-4 H) (ml) On Days 1 And 168, Day 1 (Breo Ellipta Spl Graphic 07)
Line graph showing the mean change from baseline in FEV1 (mL) over time (minutes) after dose administration. The graph compares Breo Ellipta 100/25 and 200/25, fluticasone furoate 100 mcg and 200 mcg, vilanterol 25 mcg, and placebo, illustrating changes from 0 to 240 minutes post-dose.*
FDA Label Image

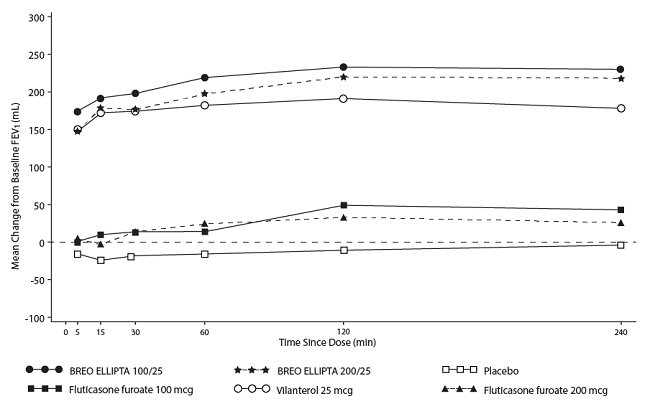
Figure 4. Raw Mean Change From Baseline In Postdose Serial Fev1 (0-4 H) (ml) On Days 1 And 168, Day 168 (Breo Ellipta Spl Graphic 08)

Figure 4. Raw Mean Change From Baseline In Postdose Serial Fev1 (0-4 H) (ml) On Days 1 And 168, Day 168 (Breo Ellipta Spl Graphic 08)
A line graph showing mean change from baseline FEV1 (mL) over time since dose (minutes) for different treatments: Breo Ellipta 100/25, Breo Ellipta 200/25, placebo, fluticasone furoate 100 mcg, fluticasone furoate 200 mcg, and vilanterol 25 mcg. The x-axis represents time points from 0 to 240 minutes, and the y-axis shows change in FEV1 values ranging from -100 to 300 mL.*
FDA Label Image

Figure 5. Least Squares (ls) Mean Change From Baseline In Postdose Serial Fev1 (0-24 H) (ml) On Days 1 And 28, Day 1 (Breo Ellipta Spl Graphic 09)

Figure 5. Least Squares (ls) Mean Change From Baseline In Postdose Serial Fev1 (0-24 H) (ml) On Days 1 And 28, Day 1 (Breo Ellipta Spl Graphic 09)
Line graph showing the least squares mean change from baseline (mL) over 24 hours for different doses of vilanterol (3.0 mcg, 6.25 mcg, 12.5 mcg, 25 mcg, 50 mcg) compared to placebo. The x-axis represents time in hours, and the y-axis represents the change in mL. Each dose is represented by a different symbol and line type.*
FDA Label Image

Figure 5. Least Squares (ls) Mean Change From Baseline In Postdose Serial Fev1 (0-24 H) (ml) On Days 1 And 28, Day 28 (Breo Ellipta Spl Graphic 10)

Figure 5. Least Squares (ls) Mean Change From Baseline In Postdose Serial Fev1 (0-24 H) (ml) On Days 1 And 28, Day 28 (Breo Ellipta Spl Graphic 10)
A line graph showing the least squares mean change from baseline in milliliters over 24 hours for different doses of vilanterol (3.0, 6.25, 12.5, 25, and 50 mcg) compared to placebo. The x-axis represents time in hours, and the y-axis shows the change in lung function volume (mL). The graph illustrates how lung function varies over time with different vilanterol doses versus placebo.*
FDA Label Image

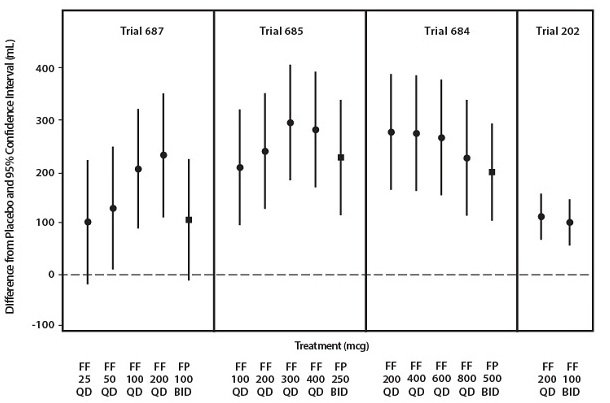
Figure 6: Fluticasone Furoate Dose-ranging And Dose-frequency Trials (Breo Ellipta Spl Graphic 11)

Figure 6: Fluticasone Furoate Dose-ranging And Dose-frequency Trials (Breo Ellipta Spl Graphic 11)
A chart showing differences from placebo with 95% confidence intervals for multiple clinical trials (687, 685, 684, 202) comparing various treatment doses of fluticasone furoate (FF) and fluticasone propionate (FP) in micrograms, with different dosing schedules (QD and BID). The vertical axis represents the measured difference in mL, and the horizontal axis lists treatment types and doses.*
FDA Label Image

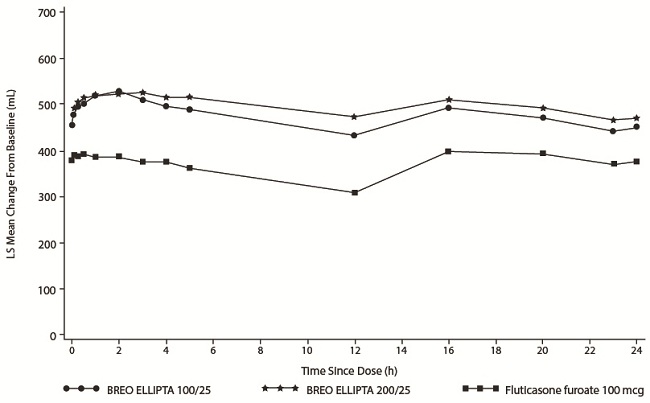
Figure 7. Least Squares (ls) Mean Change From Baseline In Individual Serial Fev1 (ml) Assessments Over 24 Hours At Day 1 (trial 1) (Breo Ellipta Spl Graphic 12)

Figure 7. Least Squares (ls) Mean Change From Baseline In Individual Serial Fev1 (ml) Assessments Over 24 Hours At Day 1 (trial 1) (Breo Ellipta Spl Graphic 12)
Line graph depicting the least squares mean change from baseline in milliliters (mL) over 24 hours following dosing. The graph compares Breo Ellipta 100/25, Breo Ellipta 200/25, and Fluticasone furoate 100 mcg, showing their respective changes in lung function measured at multiple time points since dose.*
FDA Label Image

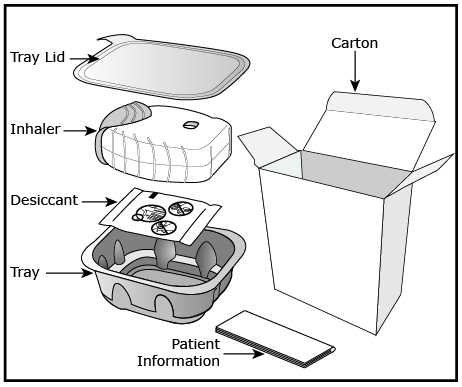
Parts Figure (Breo Ellipta Spl Graphic 13)

Parts Figure (Breo Ellipta Spl Graphic 13)
An instructional illustration showing the packaging components for Breo Ellipta respiratory powder inhaler by GlaxoSmithKline LLC. It depicts a carton, tray, tray lid, desiccant packet, the inhaler device itself, and accompanying patient information leaflet.*
FDA Label Image

Figure A (Breo Ellipta Spl Graphic 14)

Figure A (Breo Ellipta Spl Graphic 14)
An instructional illustration showing a hand peeling back a foil cover from a blister tray containing multiple capsules or tablets, demonstrating the method to open the packaging.*
FDA Label Image

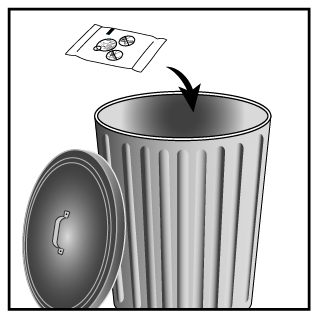
Figure B (Breo Ellipta Spl Graphic 15)

Figure B (Breo Ellipta Spl Graphic 15)
An instructional illustration showing a packet with tablets being discarded into a trash can with a removed lid, indicating proper disposal of medication packaging or tablets.*
FDA Label Image

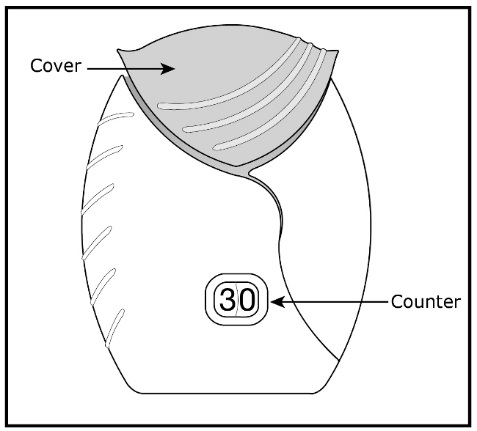
Figure C (Breo Ellipta Spl Graphic 16)

Figure C (Breo Ellipta Spl Graphic 16)
An instructional diagram of the Breo Ellipta inhaler device showing its cover and dose counter. The counter displays the number 30, indicating remaining doses in the inhaler.*
FDA Label Image

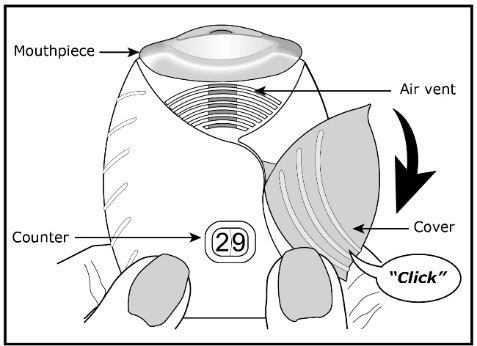
Figure D (Breo Ellipta Spl Graphic 17)

Figure D (Breo Ellipta Spl Graphic 17)
An instructional diagram showing a respiratory inhaler device held by two fingers. The image labels the mouthpiece, counter displaying the number 29, air vent, and a cover being closed with a "click" sound indicated.*
FDA Label Image

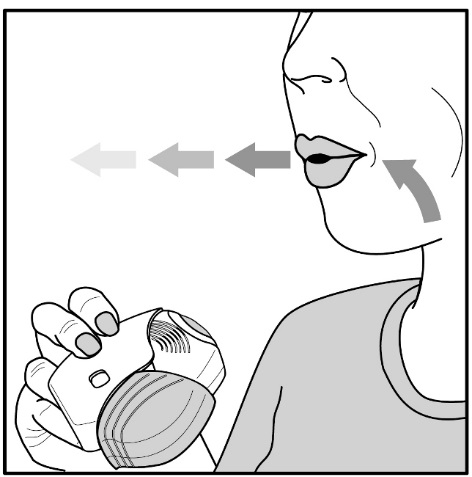
Figure E (Breo Ellipta Spl Graphic 18)

Figure E (Breo Ellipta Spl Graphic 18)
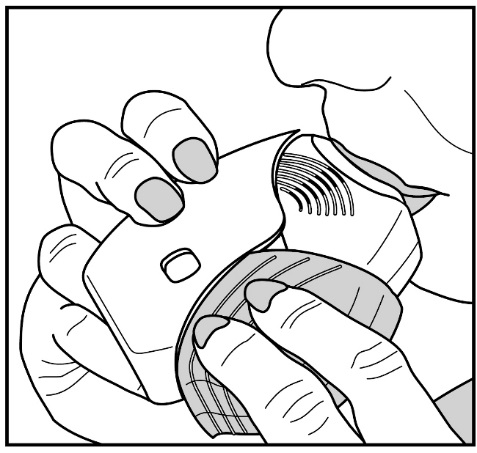
Instructional illustration showing a person using an inhaler device held near the mouth, with arrows indicating the direction of exhalation or inhalation through the mouth. The image is intended to guide respiratory inhalation technique.*
FDA Label Image

Figure F (Breo Ellipta Spl Graphic 19)

Figure F (Breo Ellipta Spl Graphic 19)
An illustration showing a person holding and using a dry powder inhaler device. The individual is positioning the inhaler near their mouth, demonstrating the method of respiratory inhalation administration for the medication.*
FDA Label Image

Figure G (Breo Ellipta Spl Graphic 20)

Figure G (Breo Ellipta Spl Graphic 20)
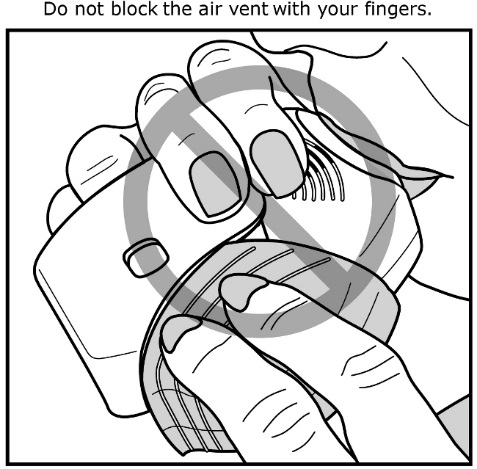
Instructional illustration showing a person holding a Breo Ellipta inhaler and using their fingers to cover the base, with a caution not to block the air vent with their fingers. The image guides proper handling of the respiratory powder inhaler device.*
FDA Label Image

Figure H (Breo Ellipta Spl Graphic 21)

Figure H (Breo Ellipta Spl Graphic 21)
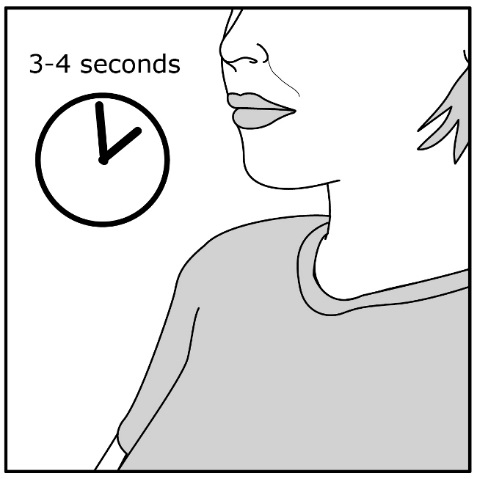
An illustration showing the side profile of a person inhaling, with a clock indicating a hold time of 3-4 seconds, likely demonstrating the breath-holding duration after inhalation. The image is simple with minimal color and no text other than the time instruction.*
FDA Label Image

Figure I (Breo Ellipta Spl Graphic 22)

Figure I (Breo Ellipta Spl Graphic 22)
An instructional illustration showing a person using the Breo Ellipta inhaler. The image depicts the individual holding the inhaler near their mouth, with arrows indicating the direction of inhalation, emphasizing the respiratory route of administration for the powder medication.*
FDA Label Image

Figure J (Breo Ellipta Spl Graphic 23)

Figure J (Breo Ellipta Spl Graphic 23)
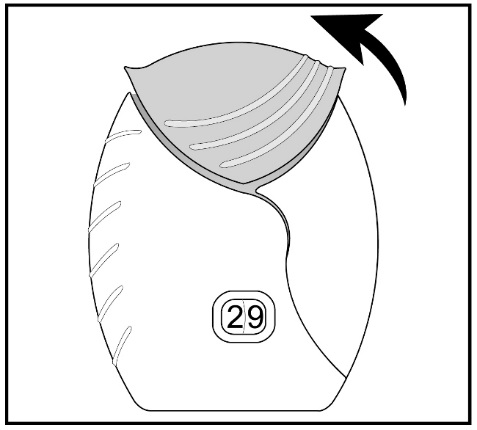
An instructional illustration showing the Breo Ellipta inhaler with its cover being opened, indicated by a curved arrow pointing upward. The device includes a dose counter displaying the number 29. This diagram likely demonstrates the initial step of preparing the inhaler for use.*
FDA Label Image

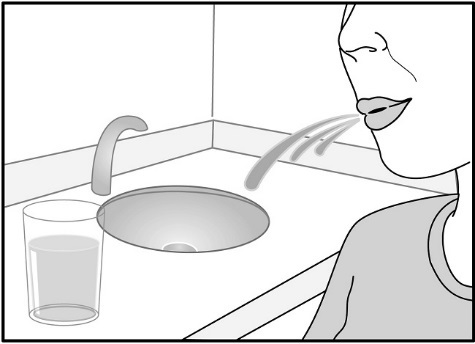
Fig K (Breo Ellipta Spl Graphic 24)

Fig K (Breo Ellipta Spl Graphic 24)
An instructional illustration showing a person rinsing their mouth by spitting water out into a sink, with a glass of water nearby. The image suggests a post-inhalation mouth rinse procedure commonly recommended after using respiratory inhalation powder medications.*
FDA Label Image

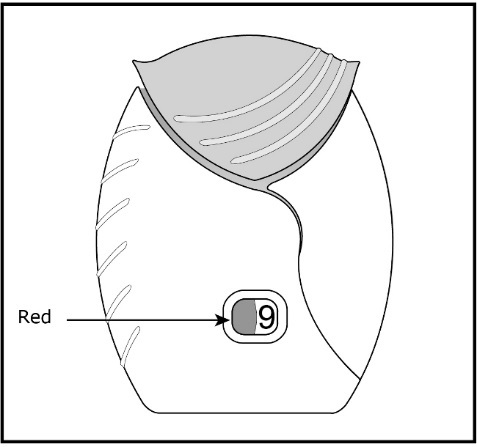
Figure K (Breo Ellipta Spl Graphic 25)

Figure K (Breo Ellipta Spl Graphic 25)
Illustration of the Breo Ellipta inhaler device showing the color indication window with red color highlighted. The device is used for respiratory inhalation of fluticasone furoate and vilanterol trifenatate powder.*
FDA Label Image

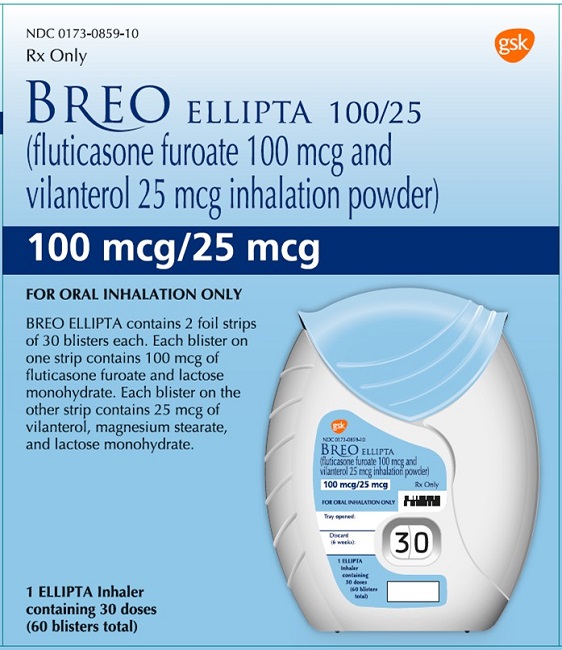
Breo Ellipta 100mcg-25mcg 30 Dose Carton (Breo Ellipta Spl Graphic 26)

Breo Ellipta 100mcg-25mcg 30 Dose Carton (Breo Ellipta Spl Graphic 26)
Breo Ellipta 100 mcg/25 mcg inhalation powder label for respiratory use. The packaging shows the active ingredients fluticasone furoate and vilanterol trifenatate with strength 100 mcg and 25 mcg. It includes an image of the Ellipta inhaler device, which contains 30 doses. Labeler is GlaxoSmithKline LLC.*
FDA Label Image

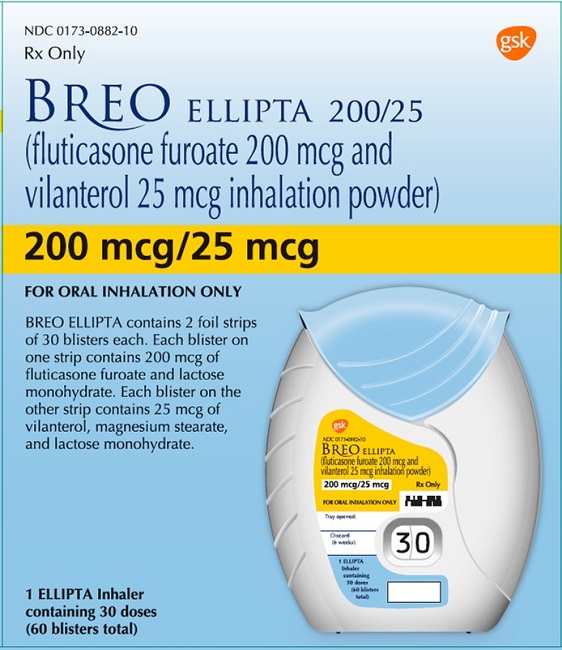
Breo Ellipta 200 Mcg-25mcg 30 Dose Carton (Breo Ellipta Spl Graphic 27)

Breo Ellipta 200 Mcg-25mcg 30 Dose Carton (Breo Ellipta Spl Graphic 27)
Breo Ellipta 200/25 mcg inhalation powder label showing fluticasone furoate 200 mcg and vilanterol 25 mcg. The label indicates the product is for oral inhalation only and includes 1 Ellipta inhaler containing 30 doses (60 blisters total). The labeler is GlaxoSmithKline LLC, with Rx only status and the GSK logo present.*

* About these descriptions: Image descriptions on this page are generated by automated AI analysis of the product label images from the manufacturer's FDA label submission (SPL). They are provided for reference only and may contain errors or omissions. Always rely on the printed label itself and the official FDA labeling, and consult a pharmacist or healthcare professional with any questions about this product.