Binosto
Product Images NDC 0178-0101

6 FDA label images from Mission Pharmacal Company · Packaging, Regulatory Labels, and Product Appearance

Product Visual Gallery

This gallery contains 6 technical images submitted to the FDA as part of the official labeling for Binosto (NDC 0178-0101). Unlike standard consumer photos, these assets often include clinical data figures, molecular chemical structures, and official manufacturer packaging layouts.

As provided by Mission Pharmacal Company, these visuals offer a comprehensive scientific overview of the product's physical and chemical identity, aiding pharmacists and researchers in product verification and study.

FDA Label Image

Alendronate Sodium 11 Description (Ad670460 Alendronat Sodium Image 1)

Alendronate Sodium 11 Description (Ad670460 Alendronat Sodium Image 1)
Chemical structure of the active ingredient shown in the image, illustrating a phosphonate compound with sodium, amine, hydroxyl, and phosphate groups, along with three water molecules (hydrated form) indicated.*
FDA Label Image

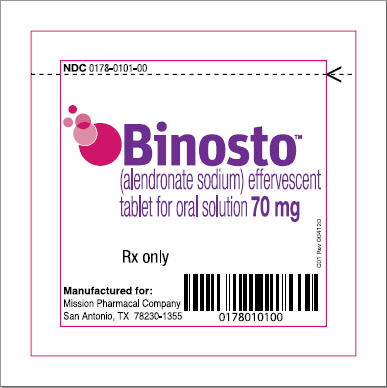
Binosto 70mg Label (Ad670460 Blister Label)

Binosto 70mg Label (Ad670460 Blister Label)
Binosto 70 mg effervescent tablet for oral solution label showing the product name with active ingredient alendronate sodium. The label includes the prescription only designation and indicates it is manufactured for Mission Pharmacal Company, San Antonio, TX. Barcode and NDC 0178-0101-00 are also visible.*
FDA Label Image

Binosto 70mg Carton 4 Tablets (Ad670460 Carton 04)

Binosto 70mg Carton 4 Tablets (Ad670460 Carton 04)
Binosto 70 mg (alendronate sodium) effervescent tablets carton label for oral solution. The package contains 4 effervescent tablets. Manufactured for Mission Pharmacal Company, the label includes storage instructions, dosage information, and pharmacist attention notice. Multiple barcodes and the product NDC 0178-0101-02 appear on the label.*
FDA Label Image

Figure 1 3 Yr Study (Ad670460 Figure 1 Placebo 3 Year Study)

Figure 1 3 Yr Study (Ad670460 Figure 1 Placebo 3 Year Study)
A line graph titled 'Cumulative Incidence of Hip Fractures in the Three-Year Study of FIT (Patients With Radiographic Vertebral Fracture at Baseline)' comparing the cumulative incidence percentage of hip fractures over 36 months between placebo and Alendronate Sodium groups.*
FDA Label Image

Figure 2 Osteoporosis (Ad670460 Figure 2 Osteoporosis)

Figure 2 Osteoporosis (Ad670460 Figure 2 Osteoporosis)
A bar chart titled 'Osteoporosis Treatment Studies in Postmenopausal Women' showing the mean percentage increase in bone mineral density (BMD) relative to placebo ± SE after three years of Alendronate Sodium 10 mg/day. The graph compares results between U.S. and multinational populations across three sites: Lumbar Spine, Femoral Neck, and Trochanter, with U.S. groups consistently showing a higher mean percentage increase in BMD at all sites.*
FDA Label Image

Figure 3 Osteoporosis (Ad670460 Figure 3 Osteoporosis)

Figure 3 Osteoporosis (Ad670460 Figure 3 Osteoporosis)
A figure showing two line graphs comparing the time course effect of Alendronate Sodium 10 mg/day versus placebo on lumbar spine bone mineral density (BMD) percent change from baseline in postmenopausal women. The left graph represents a U.S. study and the right a multinational study, both displaying mean percent BMD change over 36 months, with Alendronate Sodium showing increased BMD compared to placebo.*

* About these descriptions: Image descriptions on this page are generated by automated AI analysis of the product label images from the manufacturer's FDA label submission (SPL). They are provided for reference only and may contain errors or omissions. Always rely on the printed label itself and the official FDA labeling, and consult a pharmacist or healthcare professional with any questions about this product.