Figure 1 (Mean (SD) Concentrations of Metaxalone following an 800 mg Dose under Fasted and Fed Conditions.)
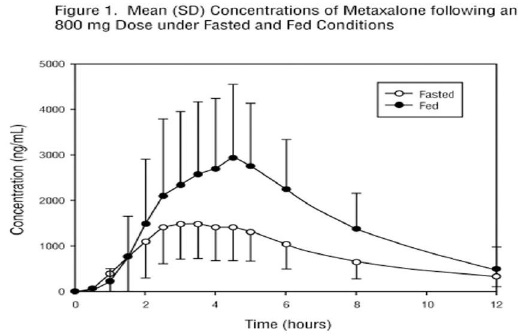
The image shows a graph with the title "Mean (SD) Concentrations of Metaxalone following an 800 mg Dose under Fasted and Fed Conditions" and the x-axis labeled "Time (hours)" ranging from 0 to 12. The y-axis is labeled "Concentration (ng/mL)" and ranges from 0 to 4000 ng/mL. The graph compares the concentration of metaxalone in the blood after an 800 mg dose under fasted and fed conditions. The graph shows that the mean concentration was higher under fed conditions.*