Epsolay
Product Images NDC 0299-5890

6 FDA label images from Galderma Laboratories, L.p. · Packaging, Regulatory Labels, and Product Appearance

Product Visual Gallery

This gallery contains 6 technical images submitted to the FDA as part of the official labeling for Epsolay (NDC 0299-5890). Unlike standard consumer photos, these assets often include clinical data figures, molecular chemical structures, and official manufacturer packaging layouts.

As provided by Galderma Laboratories, L.p., these visuals offer a comprehensive scientific overview of the product's physical and chemical identity, aiding pharmacists and researchers in product verification and study.

FDA Label Image

30g_carton_image (Pages From 083964 P201085 0 Epsolay 30g Carton)
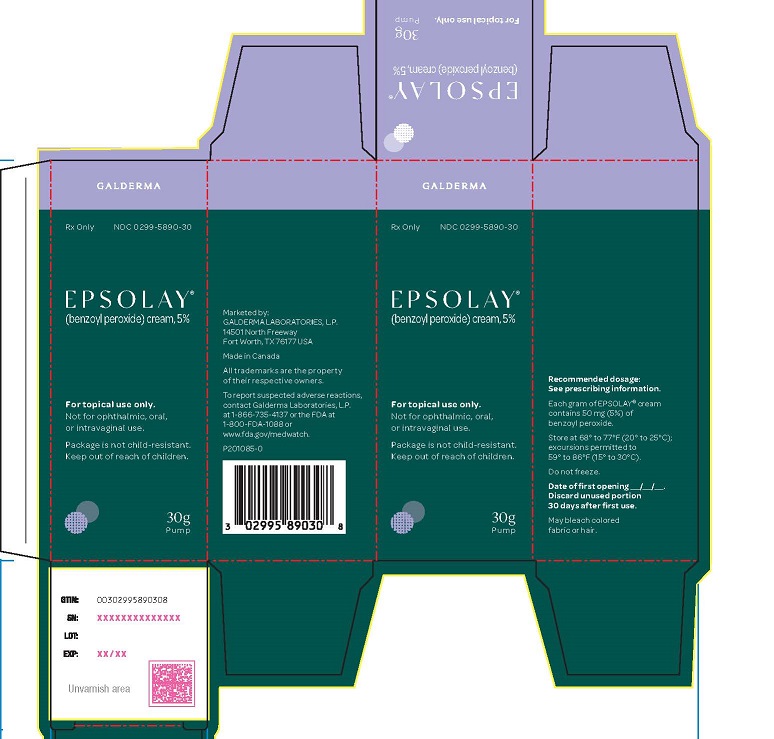
30g_carton_image (Pages From 083964 P201085 0 Epsolay 30g Carton)
Packaging label for EPSOLAY (benzoyl peroxide) cream, 5%, in a 30g pump container. The label identifies the product as Rx only, marketed by Galderma Laboratories, L.P., with instructions for topical use only. It includes storage conditions, dosage recommendation references, and safety warnings about use and packaging. The label also displays a barcode and manufacturer contact information.*
FDA Label Image

Chemical Structure (Epsolay 01)

Chemical Structure (Epsolay 01)
Chemical structure of the active ingredient shown, depicting molecular bonds and rings characteristic of the compound used in EPSOLAY by Galderma Laboratories, L.P.*
FDA Label Image

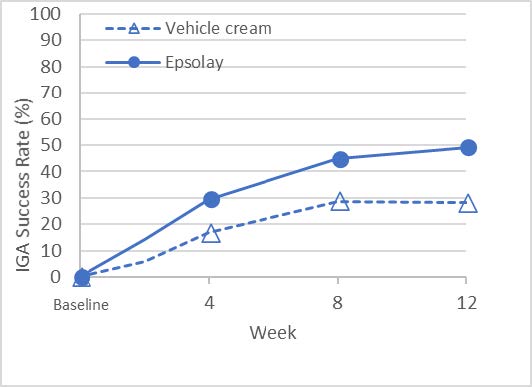
Figure 1 (Figure 1)

Figure 1 (Figure 1)
A line graph comparing the Investigator Global Assessment (IGA) Success Rate (%) over 12 weeks between Epsolay and Vehicle cream. The x-axis represents time in weeks, and the y-axis shows the IGA Success Rate percentage. Epsolay shows a steady increase in success rate from baseline to week 12, surpassing the Vehicle cream throughout the period.*
FDA Label Image

Figure 2 (Figure 2)

Figure 2 (Figure 2)
A line chart comparing IGA success rate (%) over 12 weeks between Epsolay and a vehicle cream. The x-axis represents the weeks (Baseline, 4, 8, 12) and the y-axis shows the success rate percentage, with Epsolay showing a higher success rate than vehicle cream at all measured time points.*
FDA Label Image

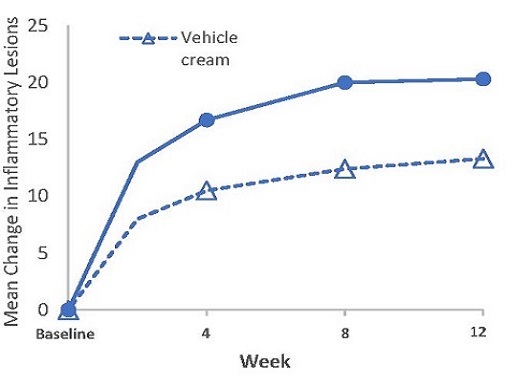
Figure 3 (Figure 3)

Figure 3 (Figure 3)
A line graph comparing the mean change in inflammatory lesions over 12 weeks between Epsolay and a vehicle cream. The x-axis represents time in weeks (Baseline, 4, 8, 12), and the y-axis shows the mean change in inflammatory lesions. Epsolay shows a greater increase over time compared to the vehicle cream, with data points highlighted for each time interval.*
FDA Label Image

Figure 4 (Figure 4)

Figure 4 (Figure 4)
A line graph depicting mean change in inflammatory lesions over 12 weeks, comparing EPSOLAY treatment and vehicle cream. The x-axis represents time in weeks (Baseline, 4, 8, 12), and the y-axis shows mean change in lesion count. EPSOLAY shows a higher mean reduction in lesions compared to vehicle cream throughout the study period.*

* About these descriptions: Image descriptions on this page are generated by automated AI analysis of the product label images from the manufacturer's FDA label submission (SPL). They are provided for reference only and may contain errors or omissions. Always rely on the printed label itself and the official FDA labeling, and consult a pharmacist or healthcare professional with any questions about this product.