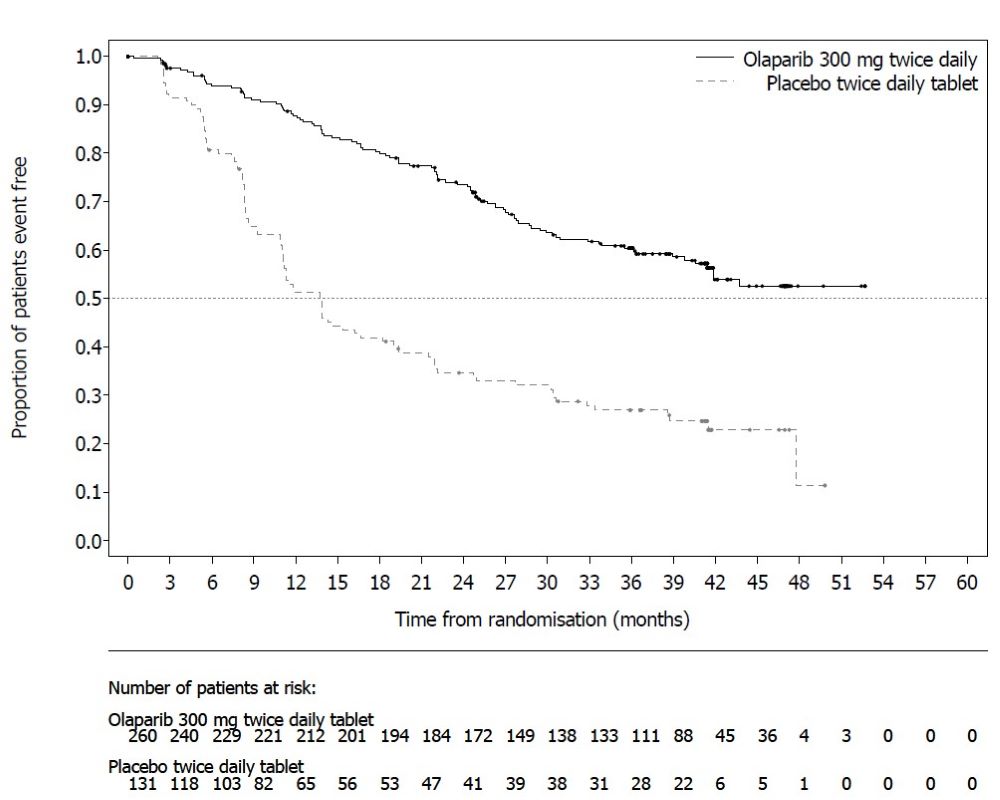
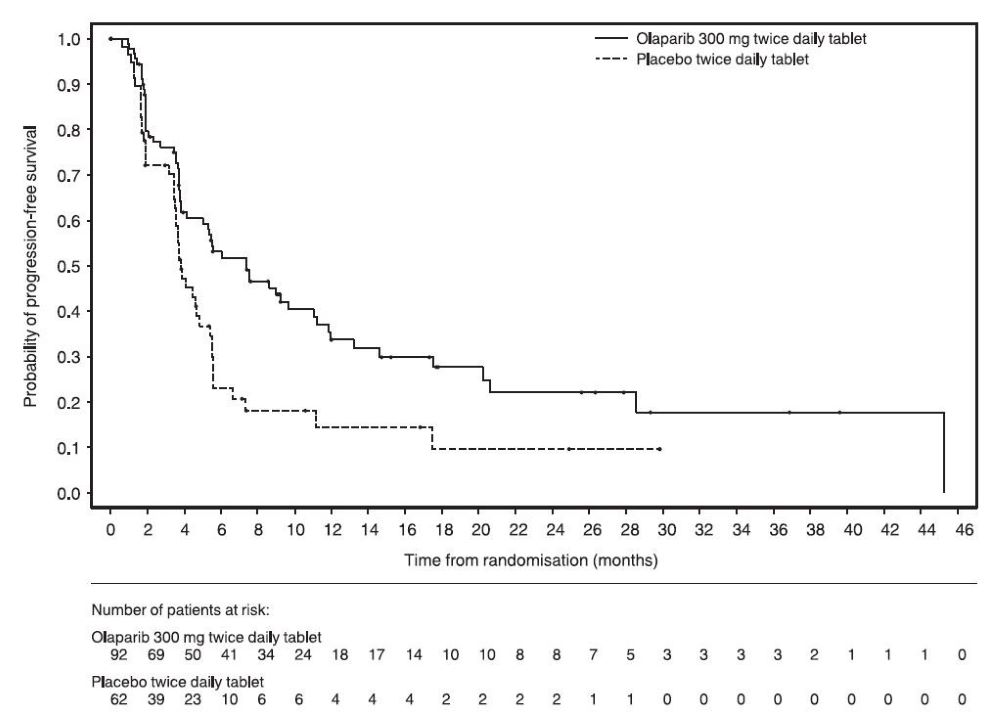
Lynparza Tablet, Film Coated
Product Images NDC 0310-0679

View Photos of Packaging, Regulatory Labels, and Product Appearance

Product Visual Gallery

This gallery contains 14 technical images submitted to the FDA as part of the official labeling for Lynparza (NDC 0310-0679). Unlike standard consumer photos, these assets often include clinical data figures, molecular chemical structures, and official manufacturer packaging layouts.

As provided by Astrazeneca Pharmaceuticals Lp, these visuals offer a comprehensive scientific overview of the product's physical and chemical identity, aiding pharmacists and researchers in product verification and study.

FDA Label Image

Figure 6

Figure 6
The text describes a graph showing the number of patients at risk over time, since randomization in a medical study. The study involved two groups of patients, one receiving a medication called 'Olaparib' and the second group receiving a placebo. The graph shows the number of patients at risk for both groups over a period of 18 months since the start of the study. The data is displayed in percentages on the X-axis, with tick marks at intervals of 25% and 50%. The Y-axis displays the number of patients at risk.*
FDA Label Image

Figure 7

FDA Label Image

Figure 1 (Figure 1)

Figure 1 (Figure 1)
This is a graph showing the proportion of patients event-free over time, with Olaparib 300mg twice daily tablet vs. Placebo twice daily tablet. The x-axis shows time from randomization in months, and the y-axis displays the proportion of patients who remain event-free. The text gives the values for the proportion of patients event-free at differing points in time, along with the number of patients at risk in each group at each of those time points.*
FDA Label Image

Figure_7 (Figure 7)

FDA Label Image

Figure_8 (Figure 8)

Figure_8 (Figure 8)
This data appears to be a graph showing the Probability of Overall Survival for two treatments (Olaparib 300 mg bd and Enzalutamide or abiraterone acetate) over a period of time represented by the number of patients at risk. There are 10 intervals in total and the number of patients at risk decreases over time for both treatments. However, the number of patients at risk for Olaparib is consistently higher than for Enzalutamide or abiraterone acetate.*
FDA Label Image

Checmical Structure (Image 01)

FDA Label Image

Figure 3 (Image 02)

FDA Label Image

Figure 4 (Image 03)

Figure 4 (Image 03)
This appears to be a graph charting the proportion of patients free from some sort of event over time. There are two treatment arms displayed- one involving an "Osparb 400 mg" capsule taken three times daily, and the other involving a placebo capsule taken twice daily. The graph is labelled with units of time, ranging from 0 to 10, and the proportion of patients free of events is displayed on the y-axis. Unfortunately, without additional context or information it's difficult to provide further details about the events being tracked and what the results may imply.*
FDA Label Image

Figure 5 (Image 04)

Figure 5 (Image 04)
The text contains a graph showing the proportion of patients event-free along with a timeline of months from randomization, and the number of patents at risk. The treatment being compared is chemotherapy and Olaparib 300 mg twice daily tablets. There is also some gibberish text present in the last line.*
FDA Label Image

Figure 6 (Image 05)

Figure 6 (Image 05)
The text describes a clinical study comparing Olaparib 300mg twice daily tablet to a Placebo twice daily tablet in terms of progression-free survival. It shows a graph of the time from randomization (in months) on the X-axis and the percentage of progression-free survival on the Y-axis. The results indicate that Olaparib was superior to Placebo in terms of progression-free survival. There were 92 patients at the start of the study in the Olaparib group and 62 in the placebo group. The number of patients decreased over time in both groups due to death or failure to complete the study.*
FDA Label Image

Figure 2 (Image 06)

Figure 2 (Image 06)
The text provides a graph showing the proportion of patients who were event-free at different time intervals. There are two groups, one receiving Olaparib + bevacizumab and the other receiving Placebo + bevacizumab. The graph shows the event-free survival rate over 42 months. The number of patients at risk is also reported for each time interval.*
FDA Label Image

Figure 4 (Image 07)

FDA Label Image

Lynparza_100mg_60tablet_bottle_label (Lynparza 100mg 60tablet Bottle Label)

FDA Label Image

Lynparza_150mg_120_tablet_bottle_label (Lynparza 150mg 120tablet Bottle)

Lynparza_150mg_120_tablet_bottle_label (Lynparza 150mg 120tablet Bottle)
Description: Olaparib tablets sold under the trademark name Lynparza, 150mg. Manufactured by AbbVie Limited in Puerto Rico for AstraZeneca Pharmaceuticals LP. It is a medication that requires a prescription and comes with a medication guide. GTIN is 00303100679122. AstraZeneca holds the trademark for Lynparza.*

* These product label images have been analyzed using experimental machine learning. Please verify findings with the primary label text.