Figure_1 (Figure 1)
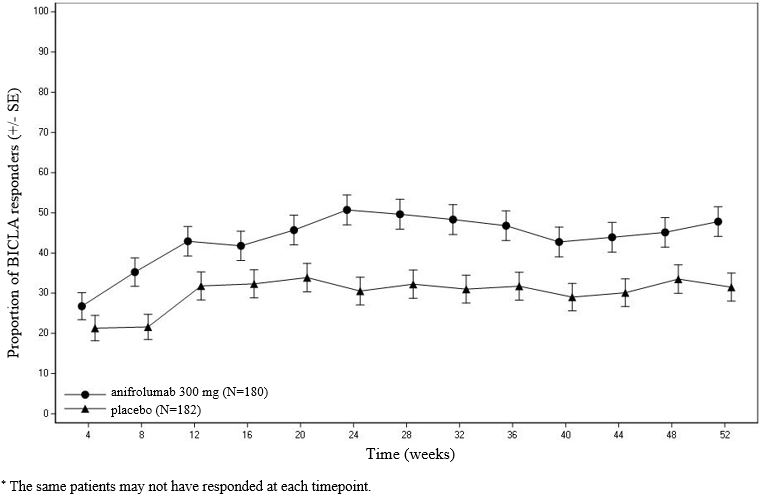
The text presents a graph showing the Proportion of BICLA responders with an error margin represented by +/- SE for patients treated with anifrolumab 300mg (N=180) and placebo (N=182) over time in weeks. There is no data available for week 0. It is indicated that the same patients may not have responded at each time point.*