Imfinzi Injection, Solution
Product Images NDC 0310-4500

15 FDA label images from Astrazeneca Pharmaceuticals Lp · Packaging, Regulatory Labels, and Product Appearance

Product Visual Gallery

This gallery contains 15 technical images submitted to the FDA as part of the official labeling for Imfinzi (NDC 0310-4500). Unlike standard consumer photos, these assets often include clinical data figures, molecular chemical structures, and official manufacturer packaging layouts.

As provided by Astrazeneca Pharmaceuticals Lp, these visuals offer a comprehensive scientific overview of the product's physical and chemical identity, aiding pharmacists and researchers in product verification and study.

FDA Label Image

Figure1 (Figure1)

Figure1 (Figure1)
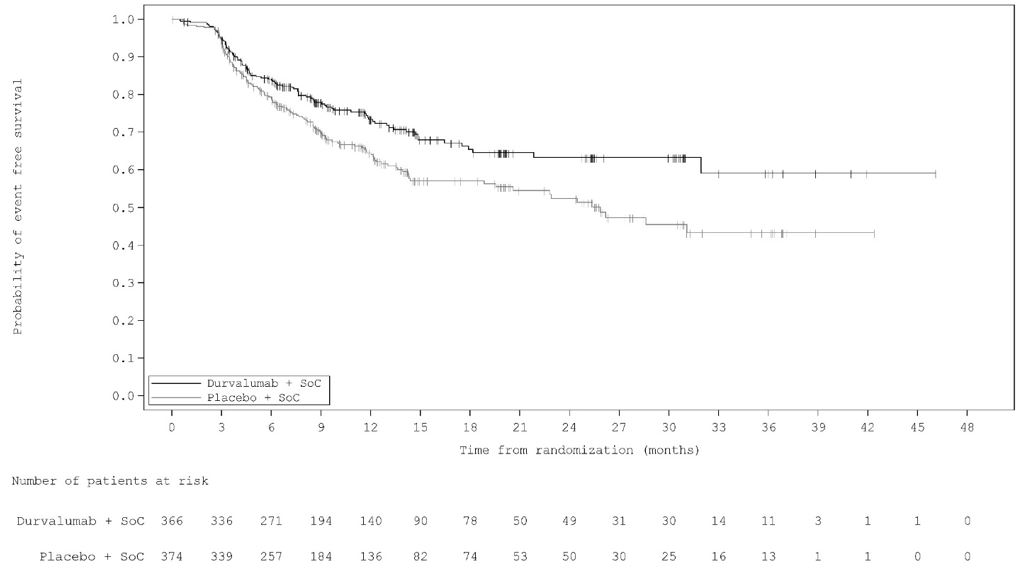
A Kaplan-Meier survival curve showing the probability of event-free survival over time in months from randomization. Two groups are compared: Durvalumab plus standard of care (SoC) and Placebo plus SoC. The graph includes survival probabilities on the y-axis and time from randomization (0 to 48 months) on the x-axis, with a table indicating the number of patients at risk at various time points for each group.*
FDA Label Image

Figure2 (Figure2)

Figure2 (Figure2)
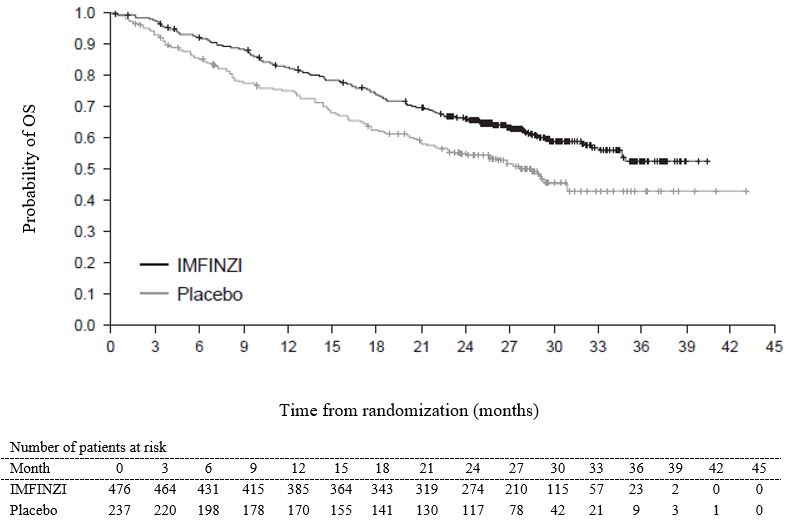
A Kaplan-Meier survival probability curve comparing overall survival (OS) between IMFINZI and placebo groups over time from randomization in months. The graph shows the probability of OS on the y-axis and time in months on the x-axis, with accompanying tables listing the number of patients at risk at each time point for both IMFINZI and placebo groups.*
FDA Label Image

Figure3 (Figure3)

Figure3 (Figure3)
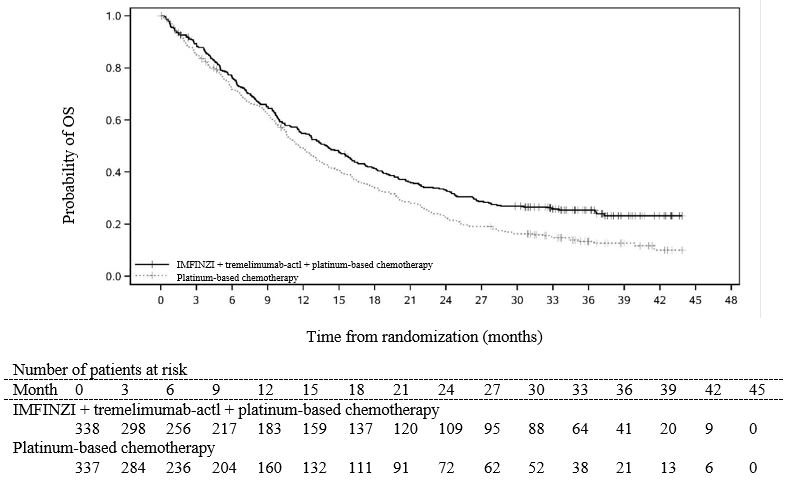
A Kaplan-Meier survival curve chart depicting the probability of overall survival (OS) over time in months from randomization. The chart compares two treatment groups: IMFINZI (Durvalumab) combined with tremelimumab and platinum-based chemotherapy, versus platinum-based chemotherapy alone. The graph shows curves with the number of patients at risk for each group listed below the time axis.*
FDA Label Image

Figure_4 (Figure 4)

Figure_4 (Figure 4)
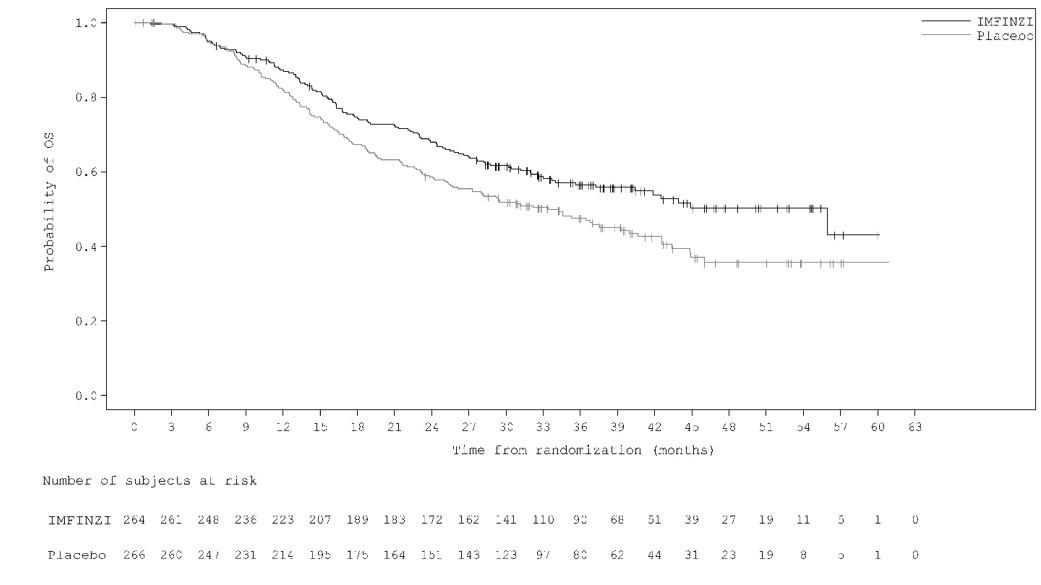
A Kaplan-Meier survival curve showing the probability of overall survival (OS) over time from randomization in months, comparing IMFINZI (Durvalumab) with placebo. The graph includes survival probabilities for IMFINZI and placebo groups, with time on the x-axis and probability of OS on the y-axis. Below the plot is a table listing the number of subjects at risk at various time points for both treatment groups.*
FDA Label Image

Figure4 (Figure4)

Figure4 (Figure4)
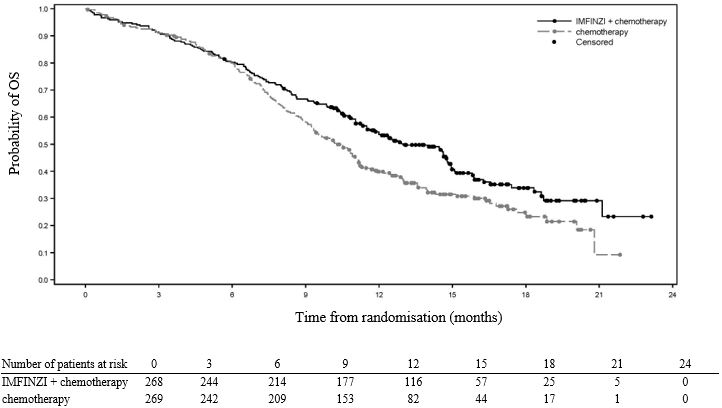
A Kaplan-Meier survival curve chart comparing the probability of overall survival (OS) over time in months from randomization. It depicts two groups: patients receiving IMFINZI (Durvalumab) plus chemotherapy and patients receiving chemotherapy alone, with censored data points indicated. The chart includes a table showing the number of patients at risk at various time points for each group.*
FDA Label Image

Figure5 (Figure5)

Figure5 (Figure5)
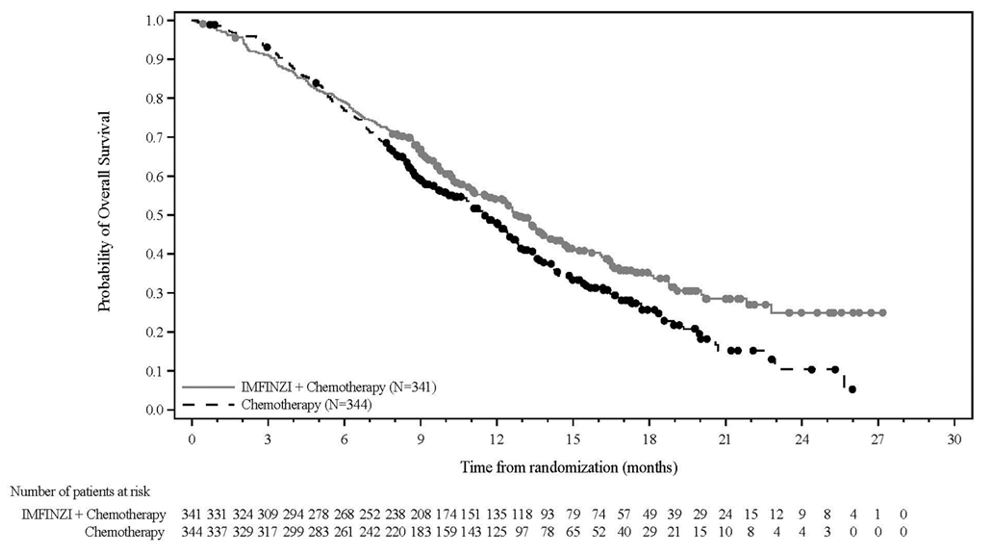
Kaplan-Meier survival curve comparing overall survival probability over time between IMFINZI (Durvalumab) plus chemotherapy and chemotherapy alone. The x-axis shows time in months from randomization, and the y-axis indicates the probability of overall survival. Two distinct survival curves are plotted, with IMFINZI plus chemotherapy showing higher survival probabilities across the follow-up period.*
FDA Label Image

Figure6 (Figure6)

Figure6 (Figure6)
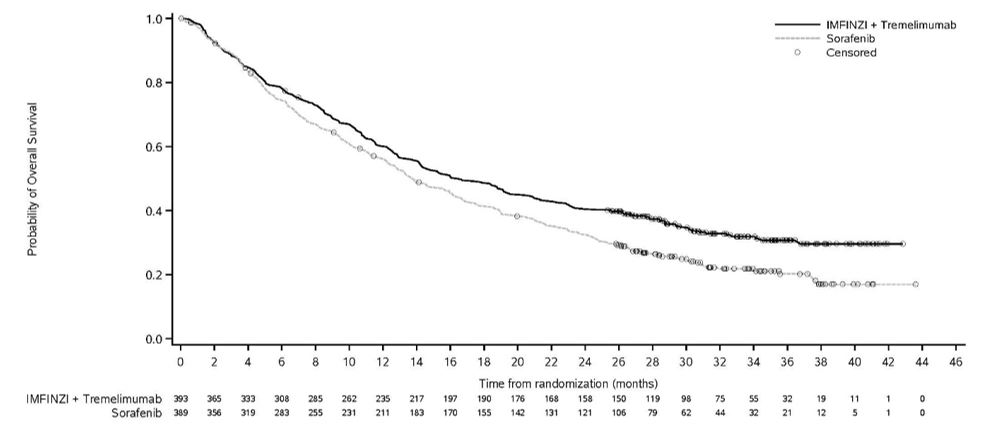
A Kaplan-Meier survival curve chart showing the probability of overall survival over time in months from randomization. It compares two treatments, IMFINZI plus Tremelimumab versus Sorafenib, with survival probability on the vertical axis and time on the horizontal axis. Censoring events are marked with circles. The chart includes patient numbers at risk grouped by months below the x-axis.*
FDA Label Image

Figure7 (Figure7)

Figure7 (Figure7)
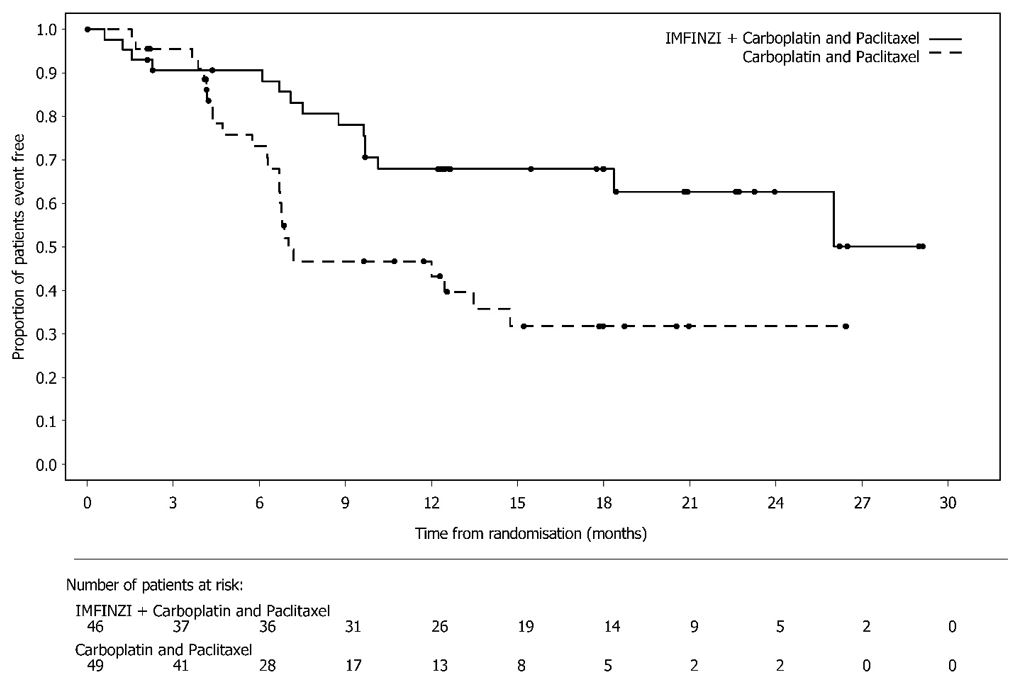
A Kaplan-Meier survival curve chart showing the proportion of patients event free over time in months from randomisation, comparing two groups: IMFINZI (durvalumab) plus Carboplatin and Paclitaxel versus Carboplatin and Paclitaxel alone. The chart includes a table of numbers of patients at risk at various time points for each group.*
FDA Label Image

Figure_9 (Figure 9 01)

Figure_9 (Figure 9 01)
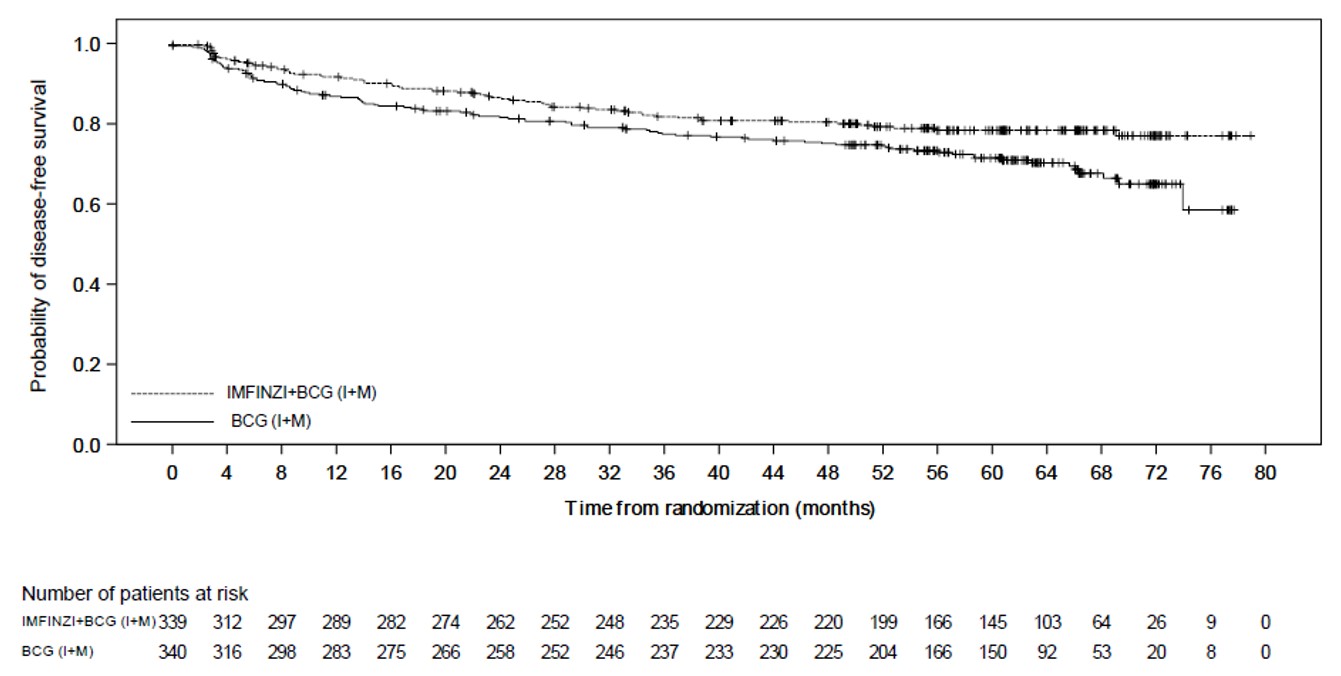
A Kaplan-Meier survival curve chart showing the probability of disease-free survival over time in months from randomization. Two groups are compared: IMFINZI with BCG (dotted line) and BCG alone (solid line). The chart includes the number of patients at risk at various time points for both groups.*
FDA Label Image

Figure_9 (Figure 9)

Figure_9 (Figure 9)
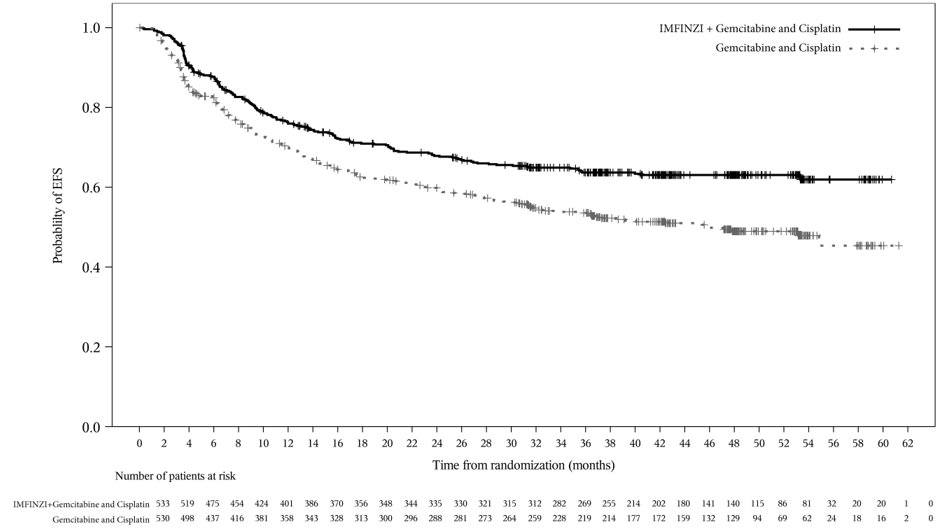
A Kaplan-Meier survival curve chart comparing the probability of event-free survival (EFS) over time (in months) between two groups: IMFINZI (Durvalumab) combined with Gemcitabine and Cisplatin versus Gemcitabine and Cisplatin alone. The solid line represents the IMFINZI combination group, and the dashed line represents the comparison group. Patient risk numbers are displayed below the timeline axis.*
FDA Label Image

Figure_10 (Figure 10)

Figure_10 (Figure 10)
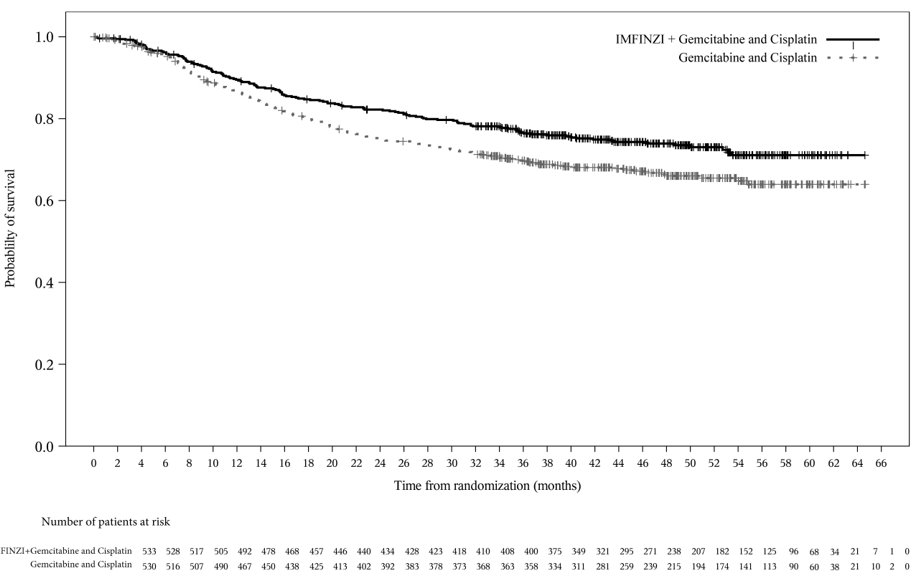
A Kaplan-Meier survival curve graph showing the probability of survival over time (months) from randomization for two groups: IMFINZI (Durvalumab) combined with Gemcitabine and Cisplatin, and Gemcitabine and Cisplatin alone. The graph includes a survival probability scale from 0 to 1 and a timeline extending to 66 months with patient numbers at risk listed below the x-axis.*
FDA Label Image

Figure_11 (Figure 11)

Figure_11 (Figure 11)
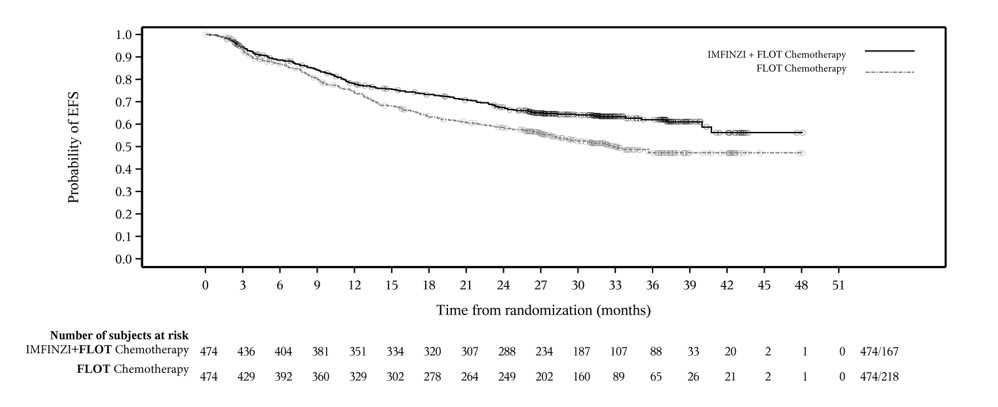
A Kaplan-Meier survival curve comparing the probability of event-free survival (EFS) over time in months from randomization between two groups: IMFINZI plus FLOT chemotherapy and FLOT chemotherapy alone. The graph includes a risk table showing the number of subjects at risk for each group at various time points up to 51 months.*
FDA Label Image

Figure_12 (Figure 12)

Figure_12 (Figure 12)
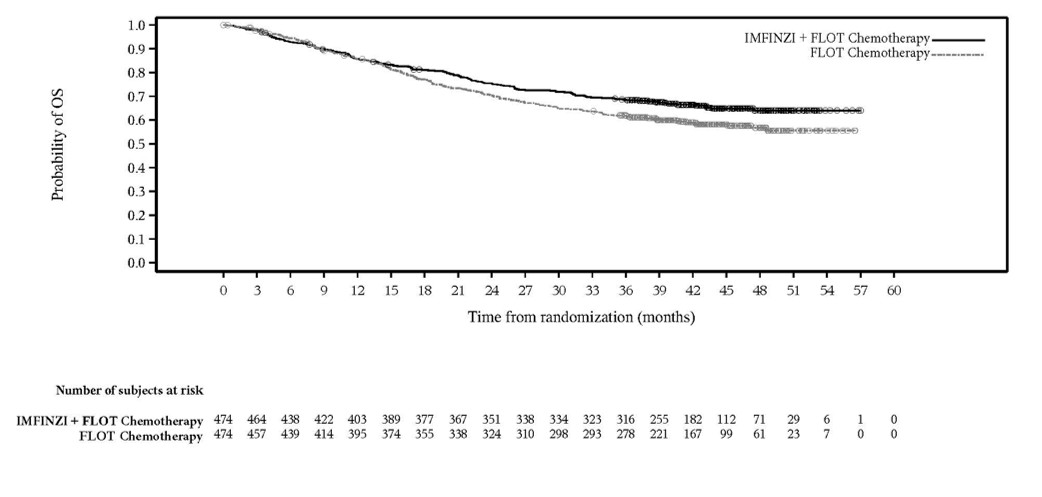
A survival probability chart comparing overall survival (OS) of patients receiving IMFINZI plus FLOT chemotherapy versus FLOT chemotherapy alone. The x-axis shows time from randomization in months (0 to 60) and the y-axis shows the probability of OS from 0.0 to 1.0. Two survival curves are displayed, with IMFINZI plus FLOT chemotherapy represented by a solid line and FLOT chemotherapy by a dashed line. Below the graph, a table lists the number of subjects at risk over time for both treatment groups.*
FDA Label Image

0310450012 (0310450012)

0310450012 (0310450012)
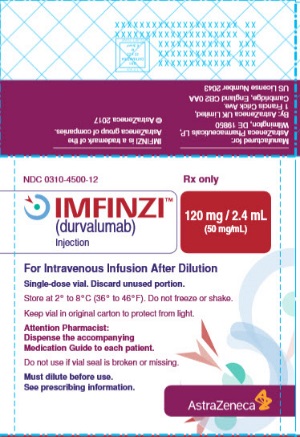
IMFINZI (durvalumab) injection label for intravenous use, 120 mg/2.4 mL (50 mg/mL) strength. The label includes storage instructions, handling precautions, and a pharmacist alert to dispense the medication guide. The product is labeled as Rx only and manufactured by AstraZeneca Pharmaceuticals LP.*
FDA Label Image

0310461150 (0310461150)

0310461150 (0310461150)
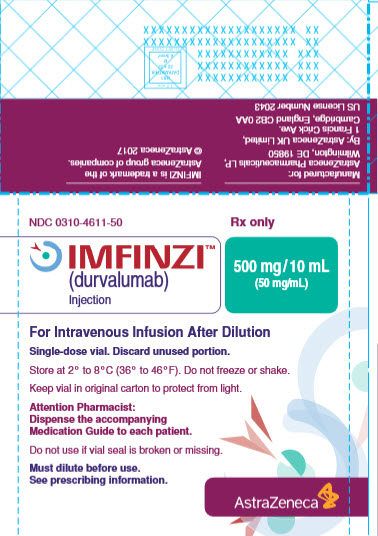
Label for IMFINZI (durvalumab) injection, solution for intravenous infusion, 500 mg/10 mL (50 mg/mL) single-dose vial. The label includes storage instructions (2° to 8°C, protect from light), pharmacist dispensing guidance, and manufacturer AstraZeneca Pharmaceuticals LP. Rx only with NDC 0310-4611-50.*

* About these descriptions: Image descriptions on this page are generated by automated AI analysis of the product label images from the manufacturer's FDA label submission (SPL). They are provided for reference only and may contain errors or omissions. Always rely on the printed label itself and the official FDA labeling, and consult a pharmacist or healthcare professional with any questions about this product.