Product Images Divalproex Sodium

View Photos of Packaging, Labels & Appearance

Product Label Images

The following 6 images provide visual information about the product associated with Divalproex Sodium NDC 0378-0473 by Mylan Pharmaceuticals Inc., such as packaging, labeling, and the appearance of the drug itself. This resource could be helpful for medical professionals, pharmacists, and patients seeking to verify medication information and ensure they have the correct product.

Divalproex Sodium Extended-Release Tablets 250 mg Bottle Label - image 01

Divalproex Sodium Extended-Release Tablets 250 mg Bottle Label - image 01

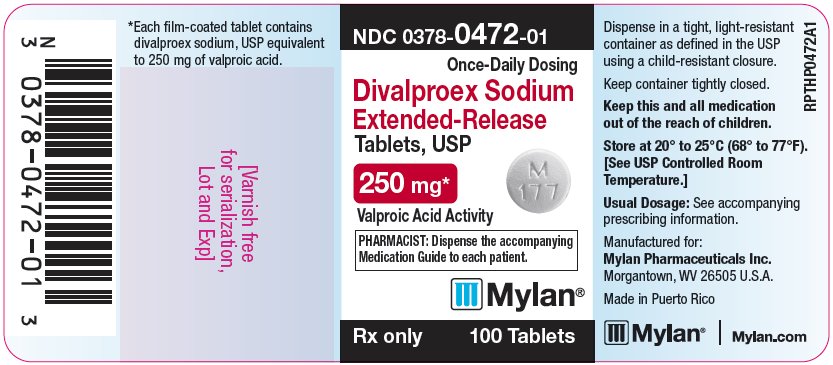
This is a description of a medication containing divalproex sodium, used to treat seizures and bipolar disorder. The tablets are extended-release and the usual dosage is specified in accompanying prescribing information. The medication guide should be given to each patient, and the tablets must be kept in a tightly closed, child-resistant container at room temperature. The manufacturer is Mylan Pharmaceuticals Inc. The text also contains a unique NDC code for the medication.*

Divalproex Sodium Extended-Release Tablets 500 mg Bottle Label - image 02

Divalproex Sodium Extended-Release Tablets 500 mg Bottle Label - image 02

Divalproex Sodium Structural Formula - image 03

Divalproex Sodium Structural Formula - image 03

Figure 1: Proportion of patients (X axis) whose percentage reduction from baseline in complex partial seizure rates was at least as great as that indicated on the Y axis in the adjunctive therapy study - image 04

Figure 1: Proportion of patients (X axis) whose percentage reduction from baseline in complex partial seizure rates was at least as great as that indicated on the Y axis in the adjunctive therapy study - image 04

The text appears to be a graph displaying % Reduction in CP$ Rate versus % of Patients along with indicators of improvement, no change or worsening. No further information is provided.*

Figure 2: Proportion of patients (X axis) whose percentage reduction from baseline in complex partial seizure rates was at least as great as that indicated on the Y axis in the monotherapy study - image 05

Figure 2: Proportion of patients (X axis) whose percentage reduction from baseline in complex partial seizure rates was at least as great as that indicated on the Y axis in the monotherapy study - image 05

This seems to be a graph showing the distribution of patients and their response to different doses of a drug called Divalroex Sodium. It looks like the graph is showing the percentage of patients who experienced certain responses to different doses of the drug, ranging from low dose to high dose. The responses seem to be classified as "No Change", "Delayed Release", and "High Dose" with varying percentages for each category. Overall, it looks like the graph is displaying the effectiveness of different doses of Divalroex Sodium on patients.*

Figure 3. Mean Reduction in 4-Week Migraine Headache Rates - image 06

Figure 3. Mean Reduction in 4-Week Migraine Headache Rates - image 06

* The product label images have been analyzed using a combination of traditional computing and machine learning techniques. It should be noted that the descriptions provided may not be entirely accurate as they are experimental in nature. Use the information in this page at your own discretion and risk.