Sorafenib Tosylate Structural Formula (9230c4d6 Db85 42be A135 E9e6ef8b9b64 01)
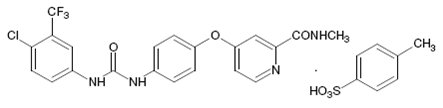
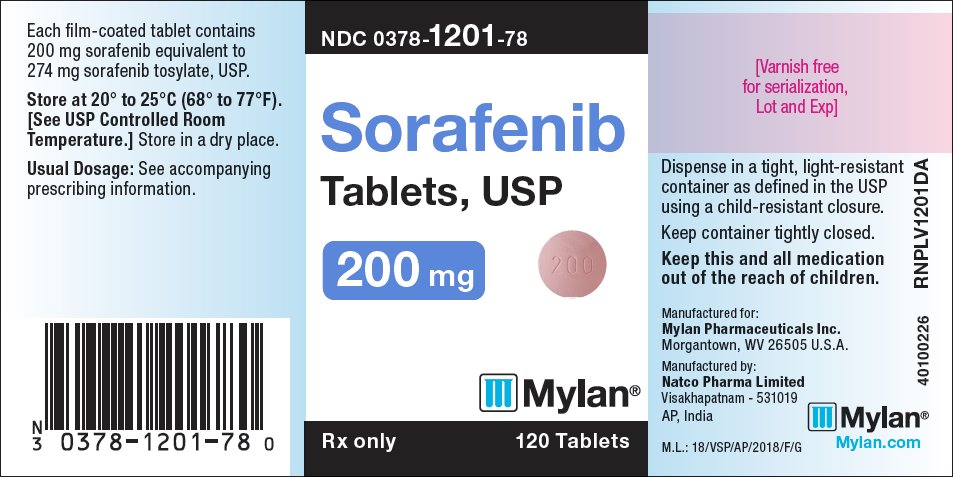
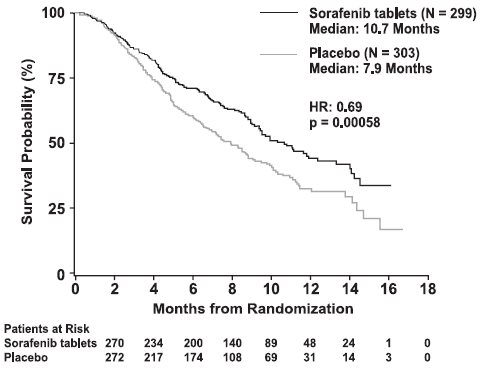
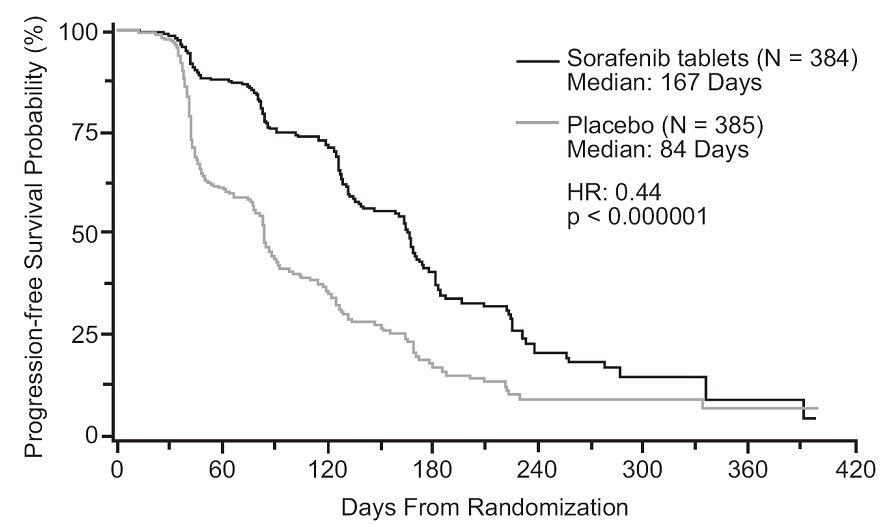
This gallery contains 5 technical images submitted to the FDA as part of the official labeling for Sorafenib Tosylate (NDC 0378-1201). Unlike standard consumer photos, these assets often include clinical data figures, molecular chemical structures, and official manufacturer packaging layouts.
As provided by Mylan Pharmaceuticals Inc., these visuals offer a comprehensive scientific overview of the product's physical and chemical identity, aiding pharmacists and researchers in product verification and study.
* These product label images have been analyzed using experimental machine learning. Please verify findings with the primary label text.