Drospirenone And Ethinyl Estradiol Kit
Product Images NDC 0378-7300

8 FDA label images from Mylan Pharmaceuticals Inc. · Packaging, Regulatory Labels, and Product Appearance

Product Visual Gallery

This gallery contains 8 technical images submitted to the FDA as part of the official labeling for Drospirenone And Ethinyl Estradiol (NDC 0378-7300). Unlike standard consumer photos, these assets often include clinical data figures, molecular chemical structures, and official manufacturer packaging layouts.

As provided by Mylan Pharmaceuticals Inc., these visuals offer a comprehensive scientific overview of the product's physical and chemical identity, aiding pharmacists and researchers in product verification and study.

FDA Label Image

Figure (B44c68b5 D0be 48b7 9cb8 8b91944326a8 01)
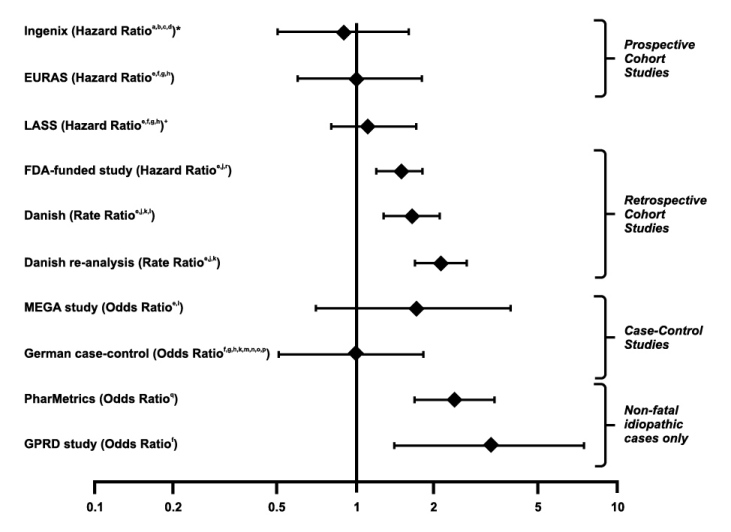
Figure (B44c68b5 D0be 48b7 9cb8 8b91944326a8 01)
A forest plot displaying hazard ratios, rate ratios, and odds ratios from various studies including prospective cohort, retrospective cohort, case-control, and non-fatal idiopathic case studies. The x-axis represents the ratio scale from 0.1 to 10, with points and confidence intervals for each study listed on the y-axis.*
FDA Label Image

Figure (B44c68b5 D0be 48b7 9cb8 8b91944326a8 02)

Figure (B44c68b5 D0be 48b7 9cb8 8b91944326a8 02)
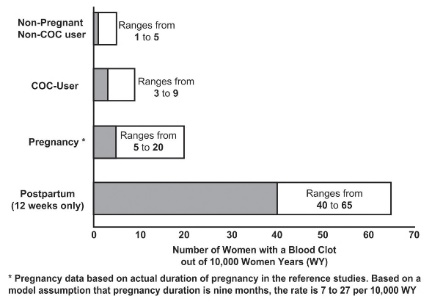
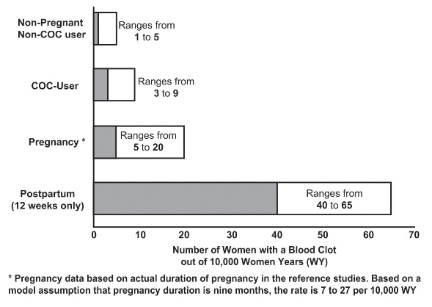
A bar chart comparing the number of women with one or more blood clots per 10,000 woman years among non-pregnant non-COC users, COC users, pregnant women, and postpartum women at 12 weeks. The chart shows ranges for each group with the highest incidence in postpartum women, followed by pregnant women, COC users, and non-pregnant non-COC users.*
FDA Label Image

Image (B44c68b5 D0be 48b7 9cb8 8b91944326a8 04)

Image (B44c68b5 D0be 48b7 9cb8 8b91944326a8 04)
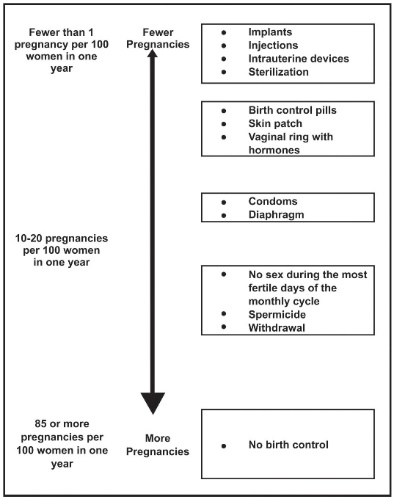
An illustration diagram showing a vertical scale of pregnancy likelihood per 100 women in one year, ranging from fewer than 1 pregnancy at the top to 85 or more pregnancies at the bottom. It categorizes various contraceptive methods by efficacy: implants, injections, intrauterine devices, and sterilization at the top (fewest pregnancies); birth control pills, skin patch, vaginal ring in the next section; condoms and diaphragm below that; no sex during fertile days, spermicide, and withdrawal further down; and no birth control at the bottom with the most pregnancies.*
FDA Label Image

Blister (B44c68b5 D0be 48b7 9cb8 8b91944326a8 05)

Blister (B44c68b5 D0be 48b7 9cb8 8b91944326a8 05)
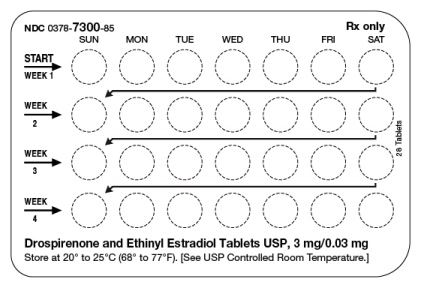
Dose schedule panel for DROSPIRENONE AND ETHINYL ESTRADIOL tablets USP, 3 mg/0.03 mg, showing a 28-day circular checklist arranged by day of the week and week number for daily pill tracking. The label includes storage instructions at controlled room temperature, 20° to 25°C, with product NDC 0378-7300 by Mylan Pharmaceuticals Inc.*
FDA Label Image

Image (B44c68b5 D0be 48b7 9cb8 8b91944326a8 06)

Image (B44c68b5 D0be 48b7 9cb8 8b91944326a8 06)
A horizontal bar chart displaying the number of women with blood clots per 10,000 women years (WY) by different categories: Non-Pregnant Non-COC user, COC user, Pregnancy, and Postpartum (12 weeks only). Each bar is segmented to show ranges for blood clot incidence within each category, with postpartum having the highest range, followed by pregnancy, COC users, and non-pregnant non-COC users.*
FDA Label Image

Drospirenone And Ethinyl Estradiol Structural Formula (Image 01)

Drospirenone And Ethinyl Estradiol Structural Formula (Image 01)
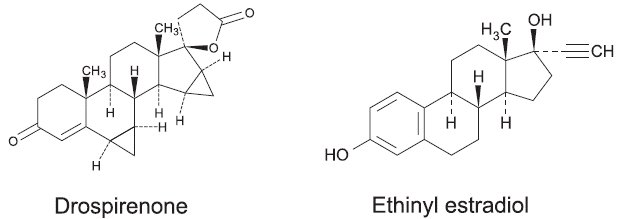
Chemical structure diagrams of the active ingredients drospirenone and ethinyl estradiol, shown side by side. The left structure represents drospirenone, and the right structure shows ethinyl estradiol.*
FDA Label Image

Image 02

Image 02
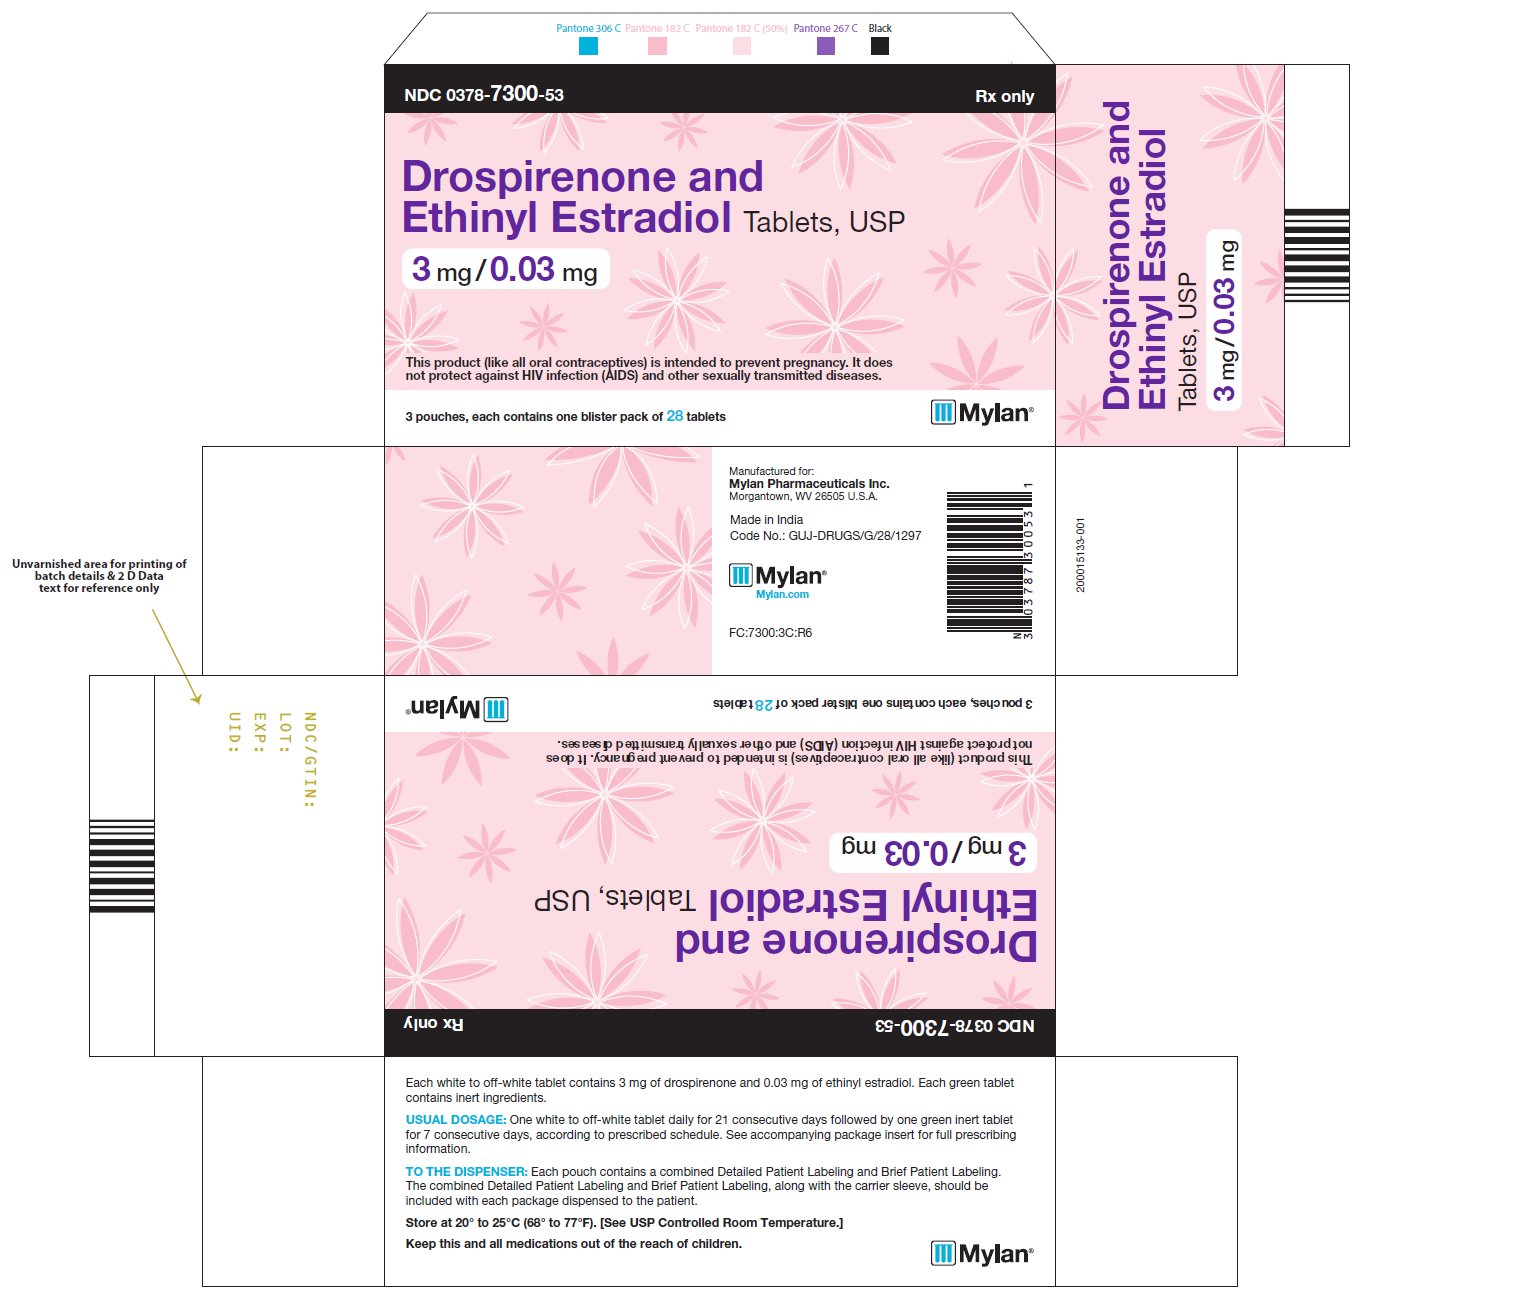
Packaging label for DROSPIRENONE AND ETHINYL ESTRADIOL tablets USP, 3 mg/0.03 mg strength, supplied as a kit containing 3 pouches with 28 tablets each. The label features a pink background with floral patterns and includes the Mylan Pharmaceuticals Inc. branding. It states the product is Rx only and includes storage instructions and manufacturing details.*
FDA Label Image

Image 03

Image 03
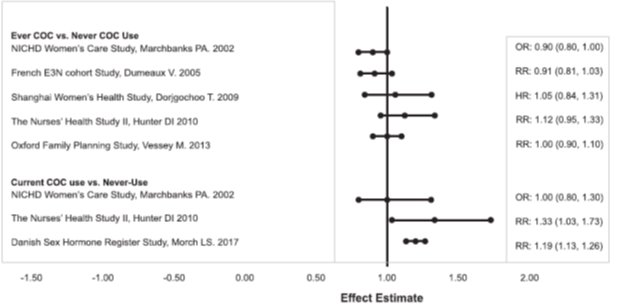
A forest plot chart showing effect estimates (odds ratios, risk ratios, hazard ratios) with confidence intervals for multiple studies comparing Ever COC use vs. Never COC use and Current COC use vs. Never-Use. The horizontal axis displays effect estimates ranging from approximately -1.50 to 2.00, with data points and confidence intervals plotted for each study listed on the left side.*

* About these descriptions: Image descriptions on this page are generated by automated AI analysis of the product label images from the manufacturer's FDA label submission (SPL). They are provided for reference only and may contain errors or omissions. Always rely on the printed label itself and the official FDA labeling, and consult a pharmacist or healthcare professional with any questions about this product.