Product Images Levalbuterol
View Photos of Packaging, Labels & Appearance
Product Label Images
The following 15 images provide visual information about the product associated with Levalbuterol NDC 0378-9691 by Mylan Pharmaceuticals Inc., such as packaging, labeling, and the appearance of the drug itself. This resource could be helpful for medical professionals, pharmacists, and patients seeking to verify medication information and ensure they have the correct product.
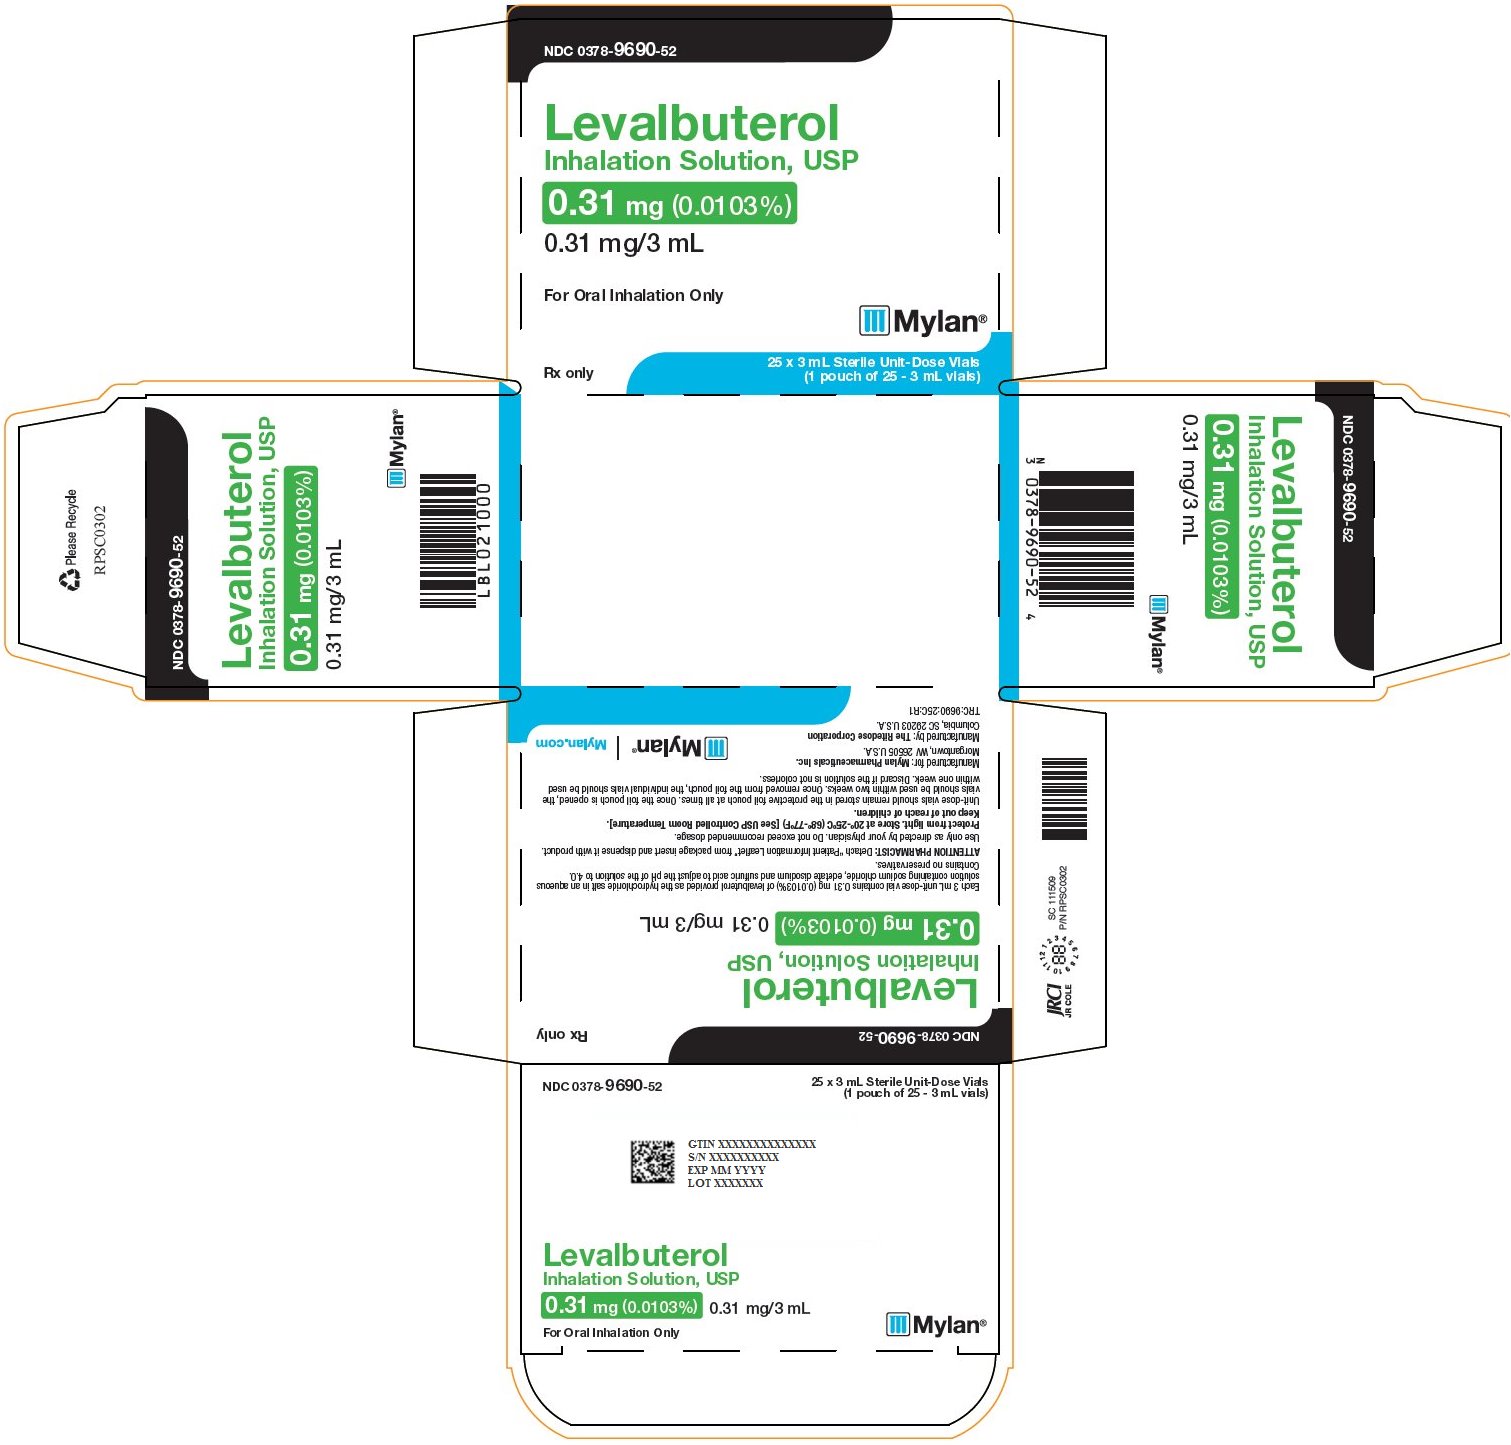
This is a description of Levalbuterol, an Inhalation Solution, USP, with a strength of 0.31mg/3mL. It is for oral inhalation only and is provided in 25 sterile unit-dose vials, each containing 3mL. The National Drug Code (NDC) for this medication is 0378-9690-52. The remaining text appears to be a mix of random characters and does not convey any useful information.*
Levalbuterol Inhalation Solution is available in 3mL Sterile Unit-Dose Vials, with 0.63 mg of levalbuterol in each vial for oral inhalation. The product comes in a pouch of 25 vials. The NDC code is 0378-9691-52. Manufacturing and expiration dates are noted but the output is illegible. The product is made by Mylan.*
This is a description of a Levalbuterol Inhalation Solution, USP. The solution is contained in 25x3 mL sterile unit-dose vials, with 1.25 mg (0.042%) of the medication in each vial. The medication is intended for oral inhalation only. The NDC code for the medication is 0378-9692-52. Unfortunately, there is some garbled and unreadable text mixed in with the information.*
The text describes a "MOUTHPIECE FACE MASK" but no further information is available. Two figures, labeled "Figure E.1" and "Figure E.2" may be related to the mouthpiece face mask, but their contents are not mentioned in the text.*
This appears to be a plot showing the mean change in FEV (forced expiratory volume) in percentages over time in a study that tested four different medications: Lev1.25, Lev0.63, Rac 2.5, and a placebo (PBO). The study involved a total of 248 participants, with different sample sizes for each medication. However, without more information or context, it is difficult to fully interpret the results or draw conclusions.*
This data is likely graphical data and shows the mean change in FEV over time in hours for different groups of subjects. The groups include Lev 0.63, Lev 0.31, Rac 25, Rac 1.25, and Pbo, with corresponding sample sizes of n=__, n=__, n=60, n=64, and n=59. Without the values for the mean change in FEV, it is not possible to further interpret this data.*
This text represents a chart or a graph that shows the mean change in FEV (%), over time (hours), for five different treatments: Lev 0.63, Lev 031, Rac 2.5, Rac 1.25, and Pbo. The values represent the mean changes in FEV, expressed as a percentage, for each treatment, at different time points (0, 0.5, 1, 1.5, 2, 2.5, 3, 3.5, and 4 hours).*
* The product label images have been analyzed using a combination of traditional computing and machine learning techniques. It should be noted that the descriptions provided may not be entirely accurate as they are experimental in nature. Use the information in this page at your own discretion and risk.