Levetiracetam Injection, Solution
Product Images NDC 0409-2011

View Photos of Packaging, Regulatory Labels, and Product Appearance

Product Visual Gallery

This gallery contains 10 technical images submitted to the FDA as part of the official labeling for Levetiracetam (NDC 0409-2011). Unlike standard consumer photos, these assets often include clinical data figures, molecular chemical structures, and official manufacturer packaging layouts.

As provided by Hospira, Inc., these visuals offer a comprehensive scientific overview of the product's physical and chemical identity, aiding pharmacists and researchers in product verification and study.

FDA Label Image

Chemical Structure (Levetiracetam 01)
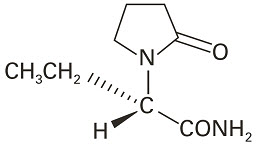
Chemical Structure (Levetiracetam 01)
Chemical structure diagram of levetiracetam, showing the molecular arrangement of its atoms and bonds in a two-dimensional format.*
FDA Label Image

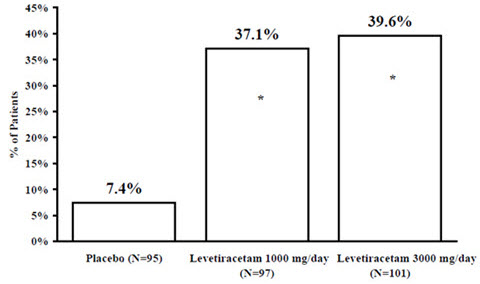
Figure 1 (Levetiracetam 02)

Figure 1 (Levetiracetam 02)
A bar chart comparing the percentage of patients for Placebo, Levetiracetam 1000 mg/day, and Levetiracetam 3000 mg/day groups. The y-axis represents the percentage of patients (0% to 45%), showing Placebo at 7.4%, Levetiracetam 1000 mg/day at 37.1%, and Levetiracetam 3000 mg/day at 39.6%, with patient counts indicated below each group.*
FDA Label Image

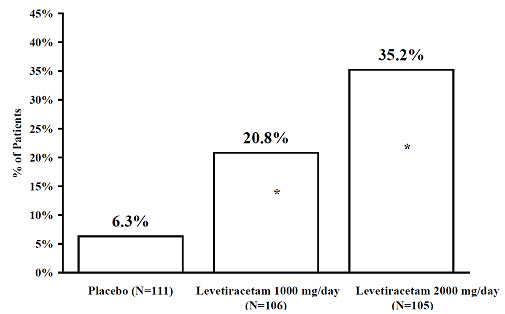
Figure 2 (Levetiracetam 03)

Figure 2 (Levetiracetam 03)
A bar graph comparing the percentage of patients across three groups: Placebo (6.3%), Levetiracetam 1000 mg/day (20.8%), and Levetiracetam 2000 mg/day (35.2%). The y-axis represents the percentage of patients, and each bar is labeled with the respective percentages. The x-axis lists patient groups with sample sizes.*
FDA Label Image

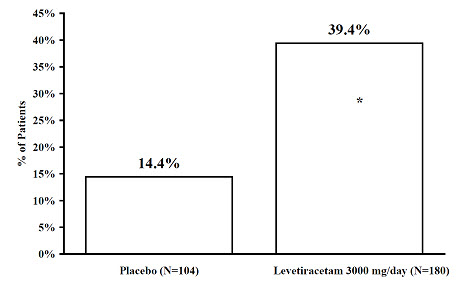
Figure 3 (Levetiracetam 04)

Figure 3 (Levetiracetam 04)
Bar chart comparing the percentage of patients between placebo and Levetiracetam 3000 mg/day treatment groups. The chart shows 14.4% of patients in the placebo group and 39.4% in the Levetiracetam group, with corresponding sample sizes of 104 and 180 patients respectively.*
FDA Label Image

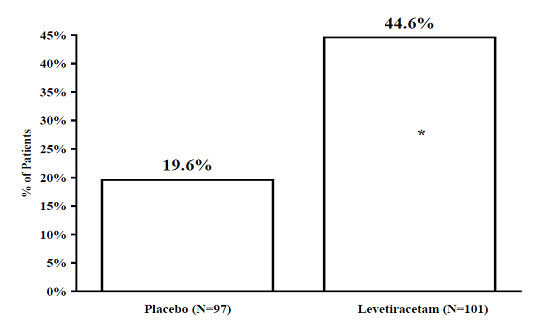
Figure 4 (Levetiracetam 05)

Figure 4 (Levetiracetam 05)
Bar chart comparing the percentage of patients between two groups: Placebo (19.6%, N=97) and Levetiracetam (44.6%, N=101). The Y-axis represents the percentage of patients, ranging from 0% to 45%. An asterisk marks the Levetiracetam bar, indicating statistical significance or importance.*
FDA Label Image

Figure 5 (Levetiracetam 06)

Figure 5 (Levetiracetam 06)
A bar chart comparing the percentage of patients between two groups: Placebo (N=51) and Levetiracetam (N=58). The y-axis represents the percentage of patients, showing approximately 19.6% for Placebo and 43.1% for Levetiracetam, indicating a higher patient percentage in the Levetiracetam group.*
FDA Label Image

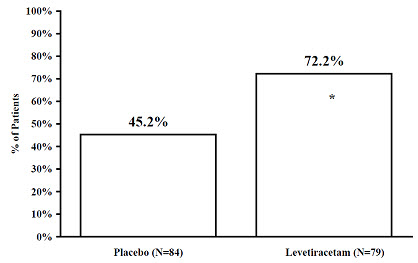
Figure 6 (Levetiracetam 07)

Figure 6 (Levetiracetam 07)
A bar chart comparing the percentage of patients between placebo (45.2%) and levetiracetam (72.2%). The x-axis shows the groups (Placebo and Levetiracetam), with sample sizes (N=84 and N=79 respectively), and the y-axis indicates the percentage of patients ranging from 0% to 100%.*
FDA Label Image

Logo (Levetiracetam 08)

FDA Label Image

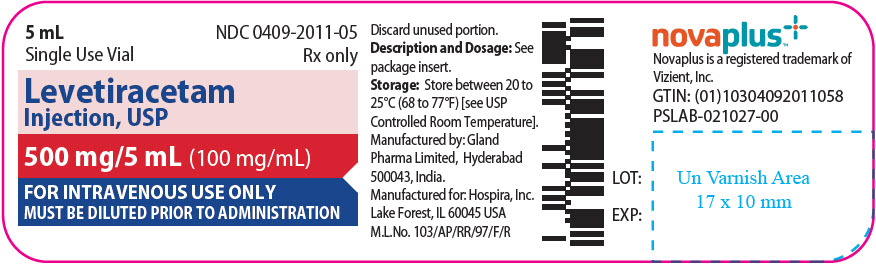
Principal Display Panel (5 mL Vial Label)

Principal Display Panel (5 mL Vial Label)
Label for Levetiracetam Injection, USP 500 mg/5 mL (100 mg/mL) solution for intravenous use in a 5 mL single-use vial. The label includes storage instructions, manufacturer information (Gland Pharma Limited, India; Hospira, Inc., USA), and a barcode. It also notes the requirement to dilute prior to administration and that it is prescription only.*
FDA Label Image

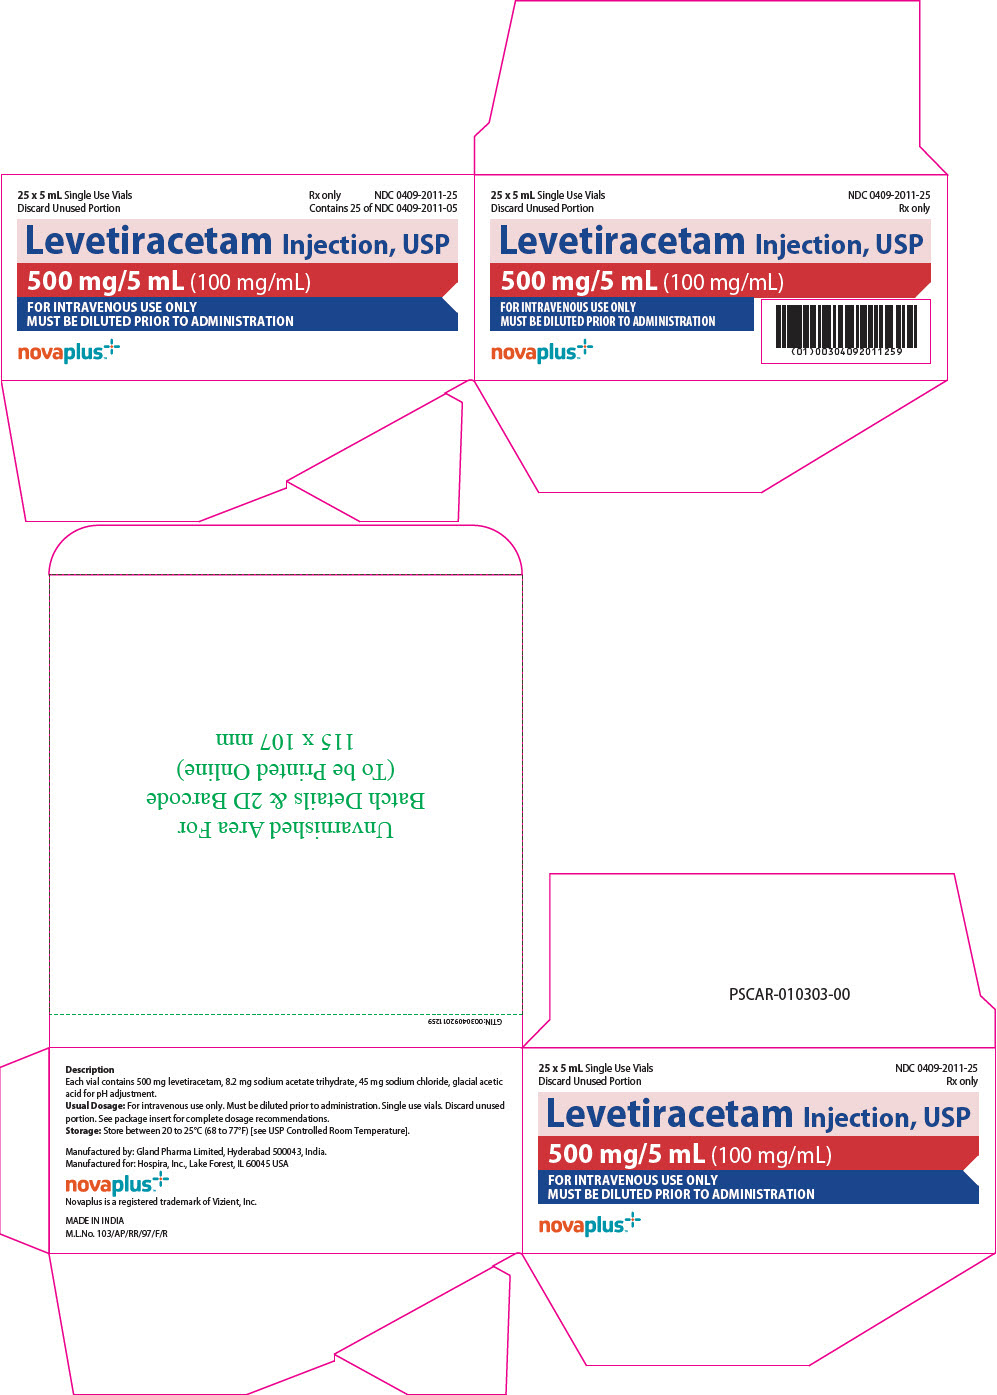
Principal Display Panel (5 mL Vial Carton)

Principal Display Panel (5 mL Vial Carton)
Levetiracetam Injection, USP 500 mg/5 mL (100 mg/mL) intravenous injection solution. The label indicates single-use vials, 25 vials of 5 mL each, manufactured by Gland Pharma Limited and labeled for Hospira, Inc. Contains usage and storage instructions, dosage strength, and the Novaplus brand logo. NDC 0409-2011-25.*

* About these descriptions: Image descriptions on this page are generated by automated AI analysis of the product label images from the manufacturer's FDA label submission (SPL). They are provided for reference only and may contain errors or omissions. Always rely on the printed label itself and the official FDA labeling, and consult a pharmacist or healthcare professional with any questions about this product.