Xtandi Capsule
Product Images NDC 0469-1125

13 FDA label images from Astellas Pharma Us, Inc. · Packaging, Regulatory Labels, and Product Appearance

Product Visual Gallery

This gallery contains 13 technical images submitted to the FDA as part of the official labeling for Xtandi (NDC 0469-1125). Unlike standard consumer photos, these assets often include clinical data figures, molecular chemical structures, and official manufacturer packaging layouts.

As provided by Astellas Pharma Us, Inc., these visuals offer a comprehensive scientific overview of the product's physical and chemical identity, aiding pharmacists and researchers in product verification and study.

FDA Label Image

Structural Formula Of Enzalutamide (Image 01)
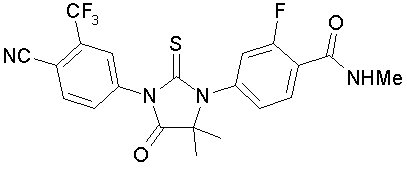
Structural Formula Of Enzalutamide (Image 01)
Chemical structure of enzalutamide, the active ingredient in Xtandi tablets. The diagram depicts the molecular arrangement of atoms and bonds characteristic of enzalutamide.*
FDA Label Image

Figure 2. Effect Of Xtandi On Other Drugs (Image 02)

Figure 2. Effect Of Xtandi On Other Drugs (Image 02)
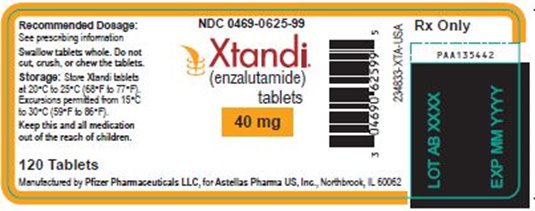
The label for Xtandi (enzalutamide) tablets displays the 40 mg strength. It includes recommended dosage instructions, storage conditions, and a 120-tablet count. The label identifies Pfizer Pharmaceuticals LLC as the manufacturer for Astellas Pharma US, Inc. The label also features the NDC number 0469-0625-99, a barcode, and space for lot number and expiration date.*
FDA Label Image

Figure 1. Effects Of Other Drugs And Intrinsic/extrinsic Factors On Xtandi (Image 03)

Figure 1. Effects Of Other Drugs And Intrinsic/extrinsic Factors On Xtandi (Image 03)
Label for Xtandi 80 mg tablets containing enzalutamide by Astellas Pharma US, Inc. The label shows the proprietary and generic names, dosage strength of 80 mg, and a count of 60 tablets. It includes storage instructions, a barcode, lot number, expiration date, and states Rx only.*
FDA Label Image

Figure 3. Kaplan-meier Curves Of Overall Survival In Affirm (Image 04)

Figure 3. Kaplan-meier Curves Of Overall Survival In Affirm (Image 04)
A Kaplan-Meier survival curve comparing survival rates over 24 months between patients treated with Xtandi (enzalutamide) and placebo. The Y-axis represents survival percentage, and the X-axis shows time in months. The graph includes median survival times, hazard ratio, and patient numbers at risk over time for both groups.*
FDA Label Image

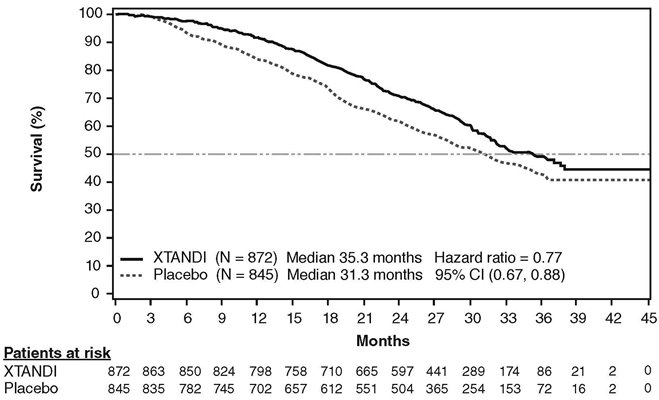
Figure 4. Kaplan-meier Curves Of Overall Survival In Prevail (Image 05)

Figure 4. Kaplan-meier Curves Of Overall Survival In Prevail (Image 05)
A survival curve chart comparing Xtandi (enzalutamide) to placebo, showing percentage survival over months up to 45. Xtandi has a higher survival rate than placebo, with median survival of 35.3 months versus 31.3 months. The graph includes a table of patients at risk at various time points and key statistics such as hazard ratio and confidence interval.*
FDA Label Image

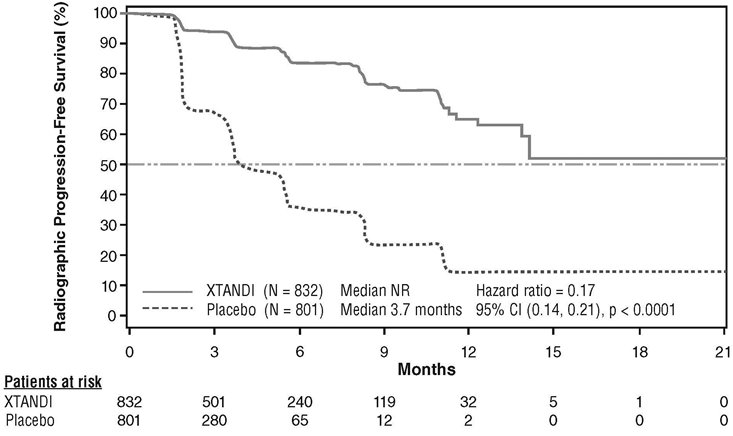
Figure 5. Kaplan-meier Curves Of Radiographic Progression-free Survival In Prevail (Image 06)

Figure 5. Kaplan-meier Curves Of Radiographic Progression-free Survival In Prevail (Image 06)
A Kaplan-Meier progression-free survival curve comparing radiographic progression-free survival percentages over months between Xtandi (enzalutamide) and placebo groups in a clinical study. The Xtandi group shows higher survival rates across 21 months, with patient risk numbers indicated below the x-axis at multiple time points.*
FDA Label Image

Figure 6. Kaplan-meier Curves Of Radiographic Progression-free Survival In Terrain (Image 07)

Figure 6. Kaplan-meier Curves Of Radiographic Progression-free Survival In Terrain (Image 07)
A Kaplan-Meier plot showing radiographic progression-free survival (%) over time in months for Xtandi (enzalutamide) compared to bicalutamide. The graph includes survival curves, median survival times, hazard ratio, confidence interval, and a table of patient numbers at risk over the study period.*
FDA Label Image

Figure 7. Kaplan-meier Curves Of Metastasis-free Survival In Prosper (Image 08)

Figure 7. Kaplan-meier Curves Of Metastasis-free Survival In Prosper (Image 08)
A Kaplan-Meier survival curve chart depicting metastasis-free survival (%) over months for Xtandi versus placebo. The Xtandi group shows higher metastasis-free survival compared to placebo, with median survival times of 36.6 months and 14.7 months respectively. The chart includes patient counts at risk over time and statistical details such as hazard ratio and confidence interval.*
FDA Label Image

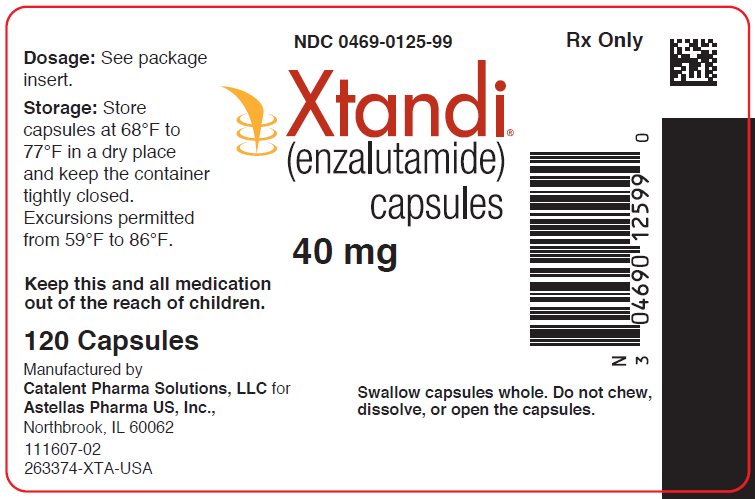
Xtandi (enzalutamide) Capsules 40 mg Label (Image 10)

Xtandi (enzalutamide) Capsules 40 mg Label (Image 10)
Label for Xtandi (enzalutamide) capsules 40 mg, containing 120 capsules. The label includes storage instructions recommending storage between 68°F to 77°F and allows excursions from 59°F to 86°F. It directs users to see the package insert for dosage. Manufactured by Catalent Pharma Solutions, LLC for Astellas Pharma US, Inc. The label advises swallowing capsules whole without chewing, dissolving, or opening.*
FDA Label Image

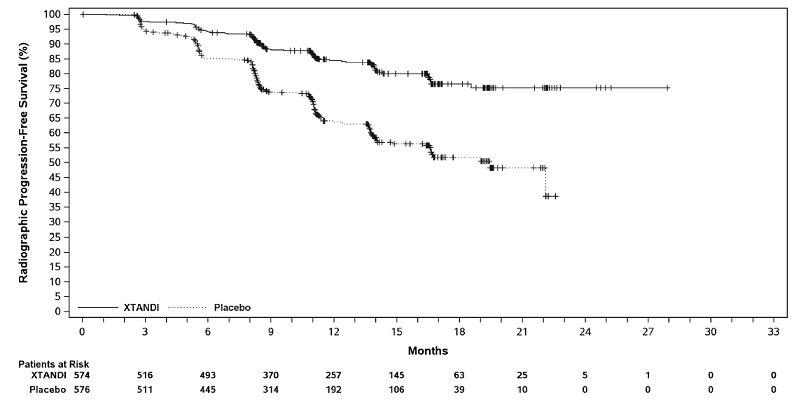
Figure 9. Kaplan-meier Curves Of Rpfs In Arches (intent-to-treat Analysis) (Image 12)

Figure 9. Kaplan-meier Curves Of Rpfs In Arches (intent-to-treat Analysis) (Image 12)
A Kaplan-Meier survival curve showing radiographic progression-free survival (%) over months for Xtandi versus placebo. The solid line represents Xtandi and the dotted line represents placebo, with the number of patients at risk listed below the x-axis at various time points up to 33 months.*
FDA Label Image

Figure 8. Kaplan-meier Curves Of Overall Survival In Prosper (Image 13)

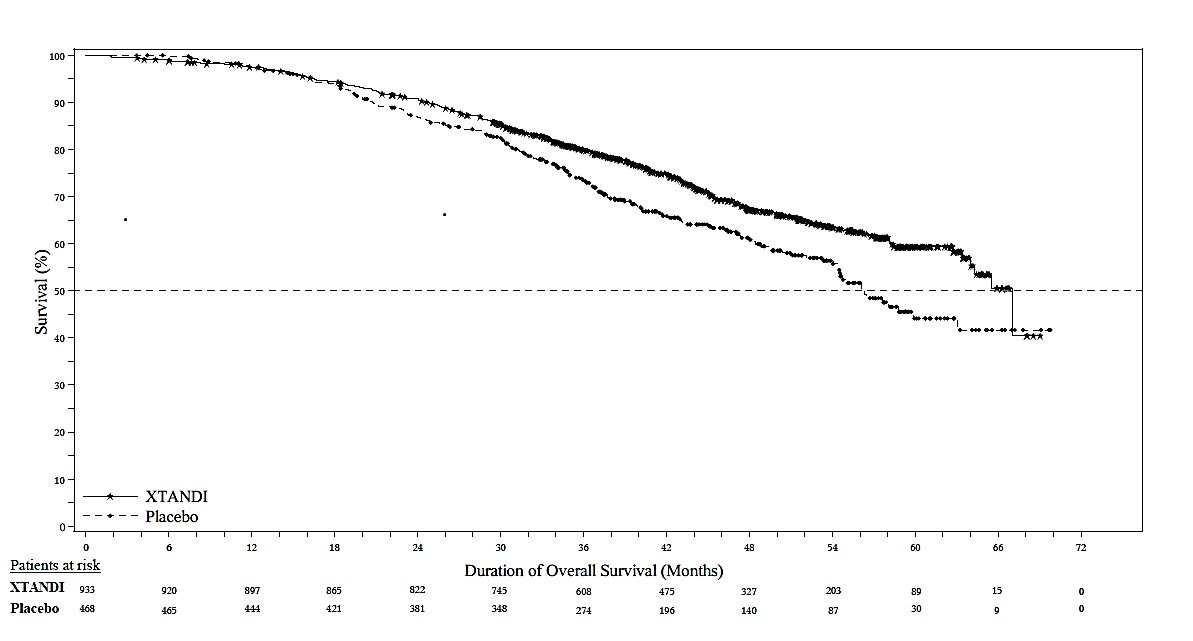
Figure 8. Kaplan-meier Curves Of Overall Survival In Prosper (Image 13)
A Kaplan-Meier survival curve chart comparing overall survival percentages over time in months between Xtandi (enzalutamide) and placebo groups. The x-axis represents duration of overall survival in months, and the y-axis shows survival percentage. Separate patient risk counts for Xtandi and placebo groups are listed below the x-axis across various time points.*
FDA Label Image

Image 14

Image 14
The packaging label for Xtandi 40 mg soft capsules by Astellas Pharma US, Inc. is shown. The label indicates the product contains 56 soft capsules as a sample not for sale. The design features the brand name Xtandi and dosage strength 40 mg prominently, with storage recommendations and dosage instructions. The label includes the Astellas logo and distinct orange, green, and red curved color accents.*
FDA Label Image

Image 15

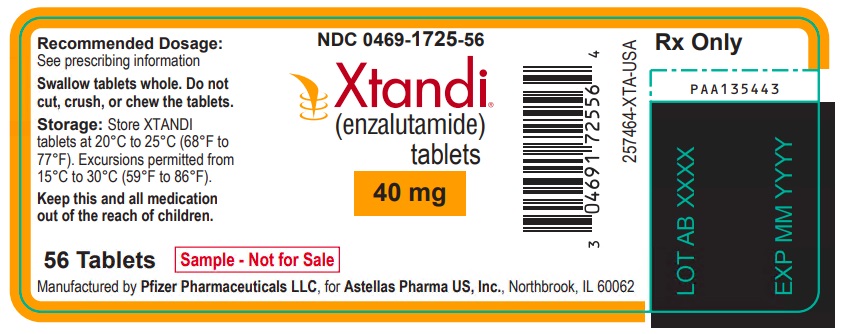
Image 15
Packaging label for Xtandi (enzalutamide) tablets, 40 mg strength. The label includes storage instructions, a warning to swallow tablets whole, and indicates a package size of 56 tablets. It is labeled as a sample, not for sale, manufactured by Pfizer Pharmaceuticals LLC for Astellas Pharma US, Inc. The label also features the NDC 0469-1725-56 and a barcode.*

* About these descriptions: Image descriptions on this page are generated by automated AI analysis of the product label images from the manufacturer's FDA label submission (SPL). They are provided for reference only and may contain errors or omissions. Always rely on the printed label itself and the official FDA labeling, and consult a pharmacist or healthcare professional with any questions about this product.