Vyloy Injection, Powder, For Suspension
Product Images NDC 0469-3425

View Photos of Packaging, Regulatory Labels, and Product Appearance

Product Visual Gallery

This gallery contains 5 technical images submitted to the FDA as part of the official labeling for Vyloy (NDC 0469-3425). Unlike standard consumer photos, these assets often include clinical data figures, molecular chemical structures, and official manufacturer packaging layouts.

As provided by Astellas Pharma Us, Inc., these visuals offer a comprehensive scientific overview of the product's physical and chemical identity, aiding pharmacists and researchers in product verification and study.

FDA Label Image

Vyloy (zolbetuximab) 100mg/vial Carton (Image 01)

Vyloy (zolbetuximab) 100mg/vial Carton (Image 01)
Carton label for VYLOY (zolbetuximab-clzb) injection, powder for suspension, 100 mg/vial (20 mg/mL reconstituted concentration). The label includes dosage and storage instructions, manufacturer information (Astellas Pharma US, Inc.), barcode, and branding with the Astellas logo. Designed for intravenous infusion with a single-dose vial.*
FDA Label Image

Figure 1 (Image 02)

Figure 1 (Image 02)
A Kaplan-Meier survival plot illustrating the probability of progression-free survival over time in months for two treatment groups. The X-axis shows duration in months, and the Y-axis represents the probability of progression-free survival. Two lines compare Z 800/600 mg/m2 + mFOLFOX6 and PBO + mFOLFOX6 treatments, with patients at risk listed below the X-axis.*
FDA Label Image

Figure 2 (Image 03)

Figure 2 (Image 03)
A Kaplan-Meier survival curve chart showing the probability of overall survival over time in months. The chart compares two treatment groups: Z 800/600 mg/m2 + mFOLFOX6 versus PBO + mFOLFOX6. Both curves start near a probability of 1.0 and decrease over approximately 42 months, with survival numbers at risk displayed below the x-axis for each time point.*
FDA Label Image

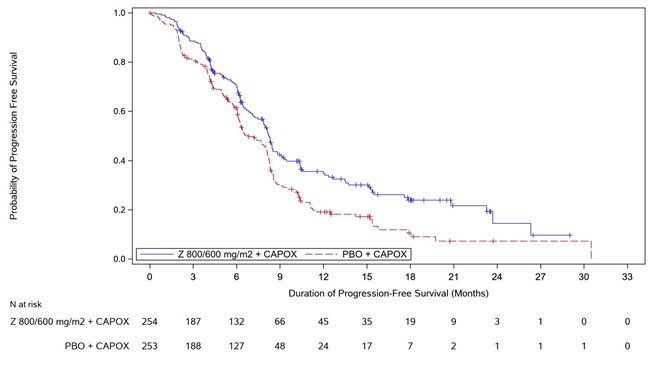
Figure 3 (Image 04)

Figure 3 (Image 04)
A Kaplan-Meier survival curve showing the probability of progression-free survival over time in months among patients treated with Zolbetuximab (Z 800/600 mg/m2) plus CAPOX compared to placebo (PBO) plus CAPOX. The plot includes survival probability on the vertical axis and duration of progression-free survival on the horizontal axis, with associated risk counts at various timepoints.*
FDA Label Image

Figure 4 (Image 05)

Figure 4 (Image 05)
A Kaplan-Meier survival curve chart depicting the probability of overall survival over time in months. It compares two groups: one receiving Zolbetuximab 800/600 mg/m2 plus CAPOX and the other receiving placebo plus CAPOX. The chart includes a table below showing the number of patients at risk at various time points for both groups.*

* About these descriptions: Image descriptions on this page are generated by automated AI analysis of the product label images from the manufacturer's FDA label submission (SPL). They are provided for reference only and may contain errors or omissions. Always rely on the printed label itself and the official FDA labeling, and consult a pharmacist or healthcare professional with any questions about this product.