Glycerol Phenylbutyrate Liquid
Product Images NDC 0480-3777

View Photos of Packaging, Regulatory Labels, and Product Appearance

Product Visual Gallery

This gallery contains 7 technical images submitted to the FDA as part of the official labeling for Glycerol Phenylbutyrate (NDC 0480-3777). Unlike standard consumer photos, these assets often include clinical data figures, molecular chemical structures, and official manufacturer packaging layouts.

As provided by Teva Pharmaceuticals, Inc., these visuals offer a comprehensive scientific overview of the product's physical and chemical identity, aiding pharmacists and researchers in product verification and study.
FDA Label Image

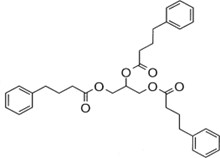
Structure (Image 1)

Structure (Image 1)
Chemical structure diagram of glycerol phenylbutyrate, displaying molecular bonds and phenyl groups attached to a glycerol backbone.*
FDA Label Image

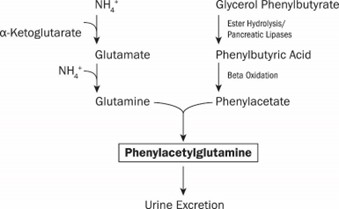
Fig. 1 (Image 2)

Fig. 1 (Image 2)
An illustration diagram showing the metabolic pathway involving glycerol phenylbutyrate. The diagram details conversion steps from glycerol phenylbutyrate through enzymatic hydrolysis to phenylbutyric acid and further beta oxidation to phenylacetate, which conjugates with glutamine to form phenylacetylglutamine, leading to urine excretion. The pathway also includes glutamate, glutamine, and alpha-ketoglutarate intermediates.*
FDA Label Image

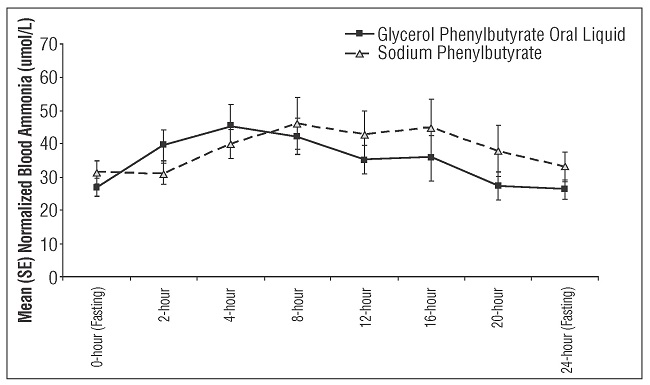
Fig.2 (Image 3)

Fig.2 (Image 3)
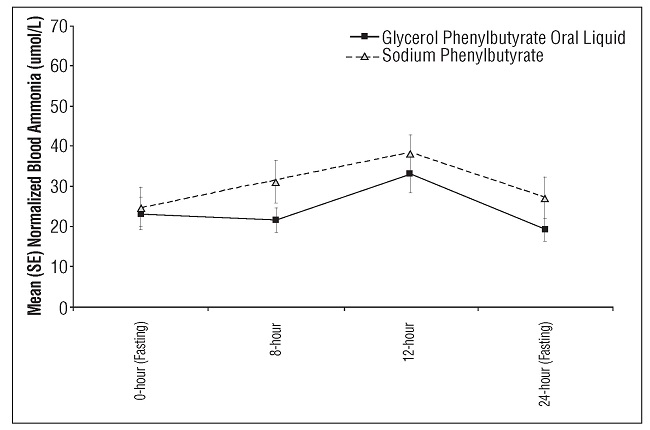
A line graph comparing mean normalized blood ammonia levels (µmol/L) over a 24-hour period for Glycerol Phenylbutyrate Oral Liquid and Sodium Phenylbutyrate. The x-axis shows time points from 0-hour (fasting) to 24-hour (fasting), and the y-axis indicates mean blood ammonia levels with standard error bars. Glycerol Phenylbutyrate is represented by a solid line with square markers, and Sodium Phenylbutyrate by a dashed line with triangle markers.*
FDA Label Image

Fig. 3 (Image 4)

Fig. 3 (Image 4)
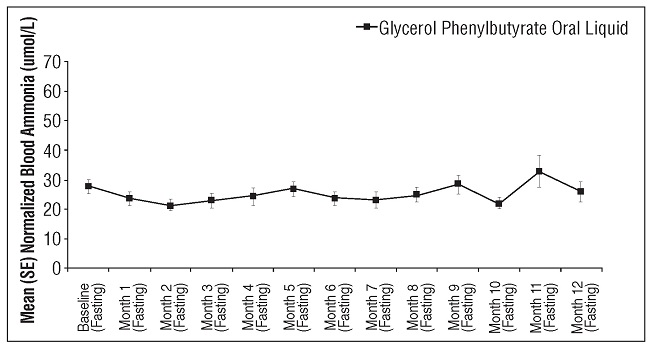
A line graph depicting mean normalized blood ammonia levels (μmol/L) with standard error bars over 12 months of fasting measurements in patients taking Glycerol phenylbutyrate oral liquid. The x-axis shows monthly time points from baseline to month 12, and the y-axis shows blood ammonia levels ranging from 0 to 70 μmol/L.*
FDA Label Image

Fig. 4 (Image 5)

Fig. 4 (Image 5)
Line graph comparing mean normalized blood ammonia levels (umol/L) over time between Glycerol Phenylbutyrate Oral Liquid and Sodium Phenylbutyrate. The x-axis shows time points at 0-hour (fasting), 8-hour, 12-hour, and 24-hour (fasting). The y-axis indicates mean normalized blood ammonia with standard error bars.*
FDA Label Image

Fig. 5 (Image 6)

Fig. 5 (Image 6)
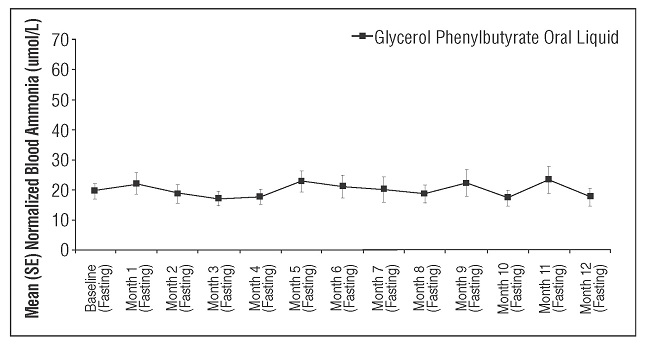
A line graph showing the mean normalized blood ammonia levels (µmol/L) with standard error bars over a 12-month fasting period for Glycerol phenylbutyrate oral liquid. The x-axis marks baseline and monthly fasting measurements, while the y-axis shows the ammonia concentration ranging roughly from 10 to 70 µmol/L.*
FDA Label Image

Ct (Image 7)

Ct (Image 7)
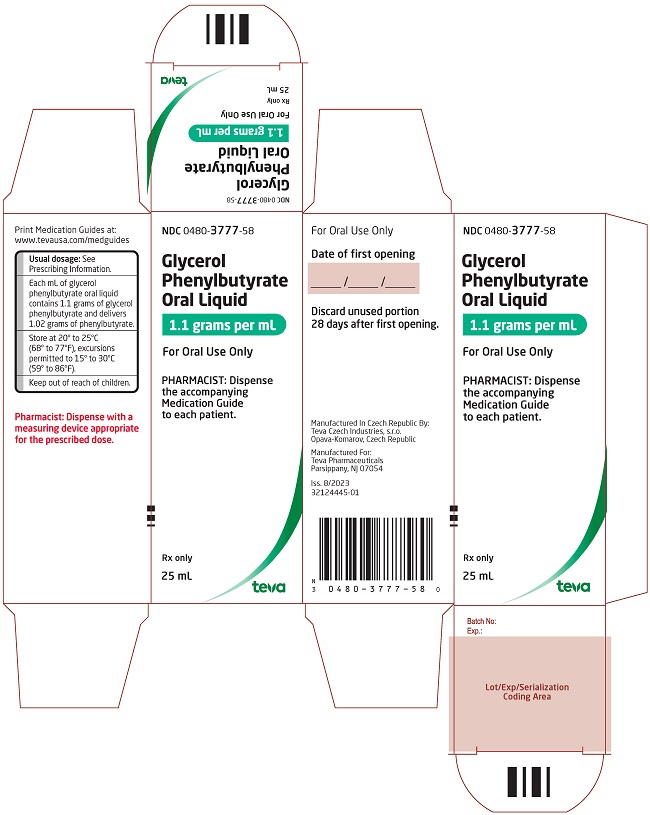
The image shows the packaging label for Glycerol Phenylbutyrate Oral Liquid, 1.1 grams per mL, manufactured by Teva Pharmaceuticals, Inc. It includes dosage strength, route as oral use only, and a 25 mL bottle size. The label instructs pharmacists to dispense a medication guide and a measuring device with the product. Additional details include storage instructions, barcode, and manufacturing information from the Czech Republic.*

* About these descriptions: Image descriptions on this page are generated by automated AI analysis of the product label images from the manufacturer's FDA label submission (SPL). They are provided for reference only and may contain errors or omissions. Always rely on the printed label itself and the official FDA labeling, and consult a pharmacist or healthcare professional with any questions about this product.