Sevoflurane Liquid
Product Images NDC 0527-6123

View Photos of Packaging, Regulatory Labels, and Product Appearance

Product Visual Gallery

This gallery contains 14 technical images submitted to the FDA as part of the official labeling for Sevoflurane (NDC 0527-6123). Unlike standard consumer photos, these assets often include clinical data figures, molecular chemical structures, and official manufacturer packaging layouts.

As provided by Lannett Company, Inc., these visuals offer a comprehensive scientific overview of the product's physical and chemical identity, aiding pharmacists and researchers in product verification and study.

FDA Label Image

Structure0- (Sevoflurane Usp 1)

Structure0- (Sevoflurane Usp 1)
Chemical structure diagram of Sevoflurane, showing atoms and bonds including trifluoromethyl groups (CF3) and a fluoromethoxy group (OCH2F).*
FDA Label Image

Figure8- (Sevoflurane Usp 10)

Figure8- (Sevoflurane Usp 10)
A line graph comparing mmHg values at different MAC levels for Sevoflurane delivered with O2 (A) and with O2/N2O (C). The y-axis represents pressure in mmHg, and the x-axis shows MAC levels from baseline to 2.5, with data points and error bars for each group.*
FDA Label Image

Figure9- (Sevoflurane Usp 11)

Figure9- (Sevoflurane Usp 11)
A line graph comparing airway resistance (dyne·sec·cm⁻⁵) at different MAC levels for Sevoflurane with oxygen (Sevo/O₂) and Sevoflurane with oxygen and nitrous oxide (Sevo/O₂/N₂O). The y-axis shows airway resistance values, and the x-axis shows MAC levels from baseline to 2. The graph includes error bars indicating variability at each point.*
FDA Label Image

Figure10- (Sevoflurane Usp 12)

Figure10- (Sevoflurane Usp 12)
A line graph showing respiratory flow rate (L/min/m²) on the y-axis versus MAC level on the x-axis, with data points for Sevoflurane with O2 and Sevoflurane with O2/N2O. The graph includes baseline and MAC levels ranging from 1 to 2, with error bars for each measurement.*
FDA Label Image

Container-lable-lannett (Sevoflurane Usp 13)

Container-lable-lannett (Sevoflurane Usp 13)
Label for Sevoflurane USP 250 mL inhalation anesthetic liquid by Lannett Company, Inc. The label includes storage instructions at controlled room temperature and manufacturer information for Shandong New Time Pharmaceutical Co., Ltd. It features the product name, strength, and bar code on a white background with yellow accents.*
FDA Label Image

Carton-lable-lannett (Sevoflurane Usp 14)

Carton-lable-lannett (Sevoflurane Usp 14)
Packaging label for Sevoflurane USP 250 mL liquid inhalation anesthetic. The label includes product name, dosage form, strength, and route of administration. It shows the NDC number 0527-6123-74, manufacturing information (Shandong New Time Pharmaceutical Co., Ltd., China), and distributor details (Lannett Company, Inc., Philadelphia, PA). The label features yellow and white background with the Lannett logo.*
FDA Label Image

Figure1- (Sevoflurane Usp 2)

Figure1- (Sevoflurane Usp 2)
A line graph depicting the relationship between fresh gas flow rate (L/min) on the x-axis and concentration of compound A in ppm on the y-axis. The graph shows a decrease in compound A concentration as fresh gas flow rate increases from 0.5 to 3 L/min, with a slight increase at 4 L/min.*
FDA Label Image

Figure2- (Sevoflurane Usp 3)

Figure2- (Sevoflurane Usp 3)
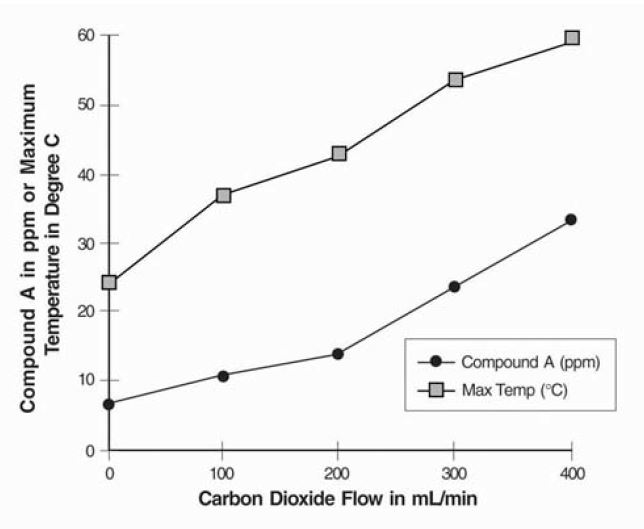
A line graph depicting the relationship between carbon dioxide flow (mL/min) on the x-axis and two variables on the y-axis: Compound A in ppm and maximum temperature in degrees Celsius. Two data series are shown, with Compound A increasing from about 6 to 33 ppm and maximum temperature rising from about 24 to 60°C as carbon dioxide flow increases from 0 to 400 mL/min.*
FDA Label Image

Figure2a- (Sevoflurane Usp 4)

Figure2a- (Sevoflurane Usp 4)
A scatter plot chart depicting the relationship between Sevoflurane exposure (MAC•Hour) on the x-axis and Inspired Compound A AUC (ppm-hr) on the y-axis. The chart includes a trend line and correlation statistics indicating a strong positive correlation (r = 0.96, p < 0.001).*
FDA Label Image

Figure3-- (Sevoflurane Usp 5)

Figure3-- (Sevoflurane Usp 5)
A line graph comparing the uptake kinetics of different inhalation agents over 30 minutes. The y-axis represents the ratio of alveolar concentration to inspired concentration (FA/FI), and the x-axis shows minutes of administration. Five agents are depicted: Halothane, Isoflurane, Sevoflurane, Desflurane, and N2O, each represented by distinct symbols on the graph.*
FDA Label Image

Figure4- (Sevoflurane Usp 6)

Figure4- (Sevoflurane Usp 6)
A logarithmic line chart showing elimination profiles of anesthetic gases over 120 minutes. The vertical axis represents the ratio FA/FA0 (alveolar concentration) on a logarithmic scale from 0.001 to 1. The horizontal axis shows minutes of elimination from 0 to 120. The chart compares Halothane, Isoflurane, Sevoflurane, Desflurane, and N2O with distinct markers and lines, illustrating their decreasing alveolar concentrations during elimination.*
FDA Label Image

Figure5- (Sevoflurane Usp 7)

Figure5- (Sevoflurane Usp 7)
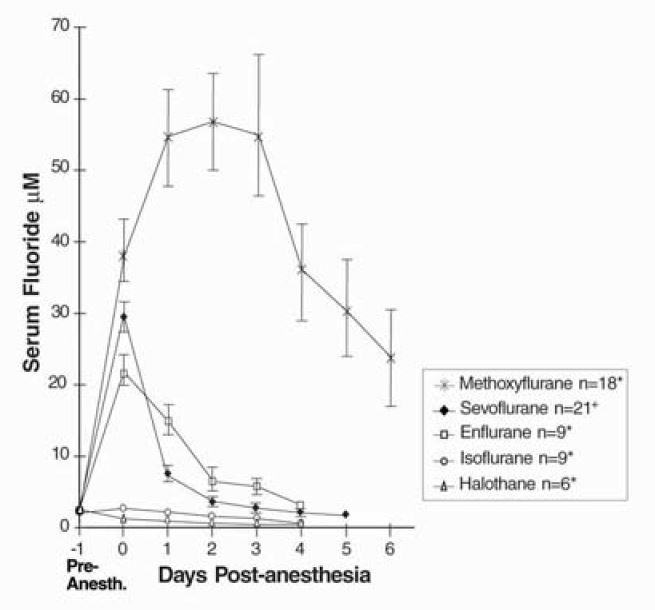
Line chart showing serum fluoride concentrations (micromolar) over days post-anesthesia for various anesthetics including Sevoflurane, Methoxyflurane, Enflurane, Isoflurane, and Halothane. The chart plots fluoride levels from pre-anesthesia through 6 days post-anesthesia with error bars for each data point.*
FDA Label Image

Figure6- (Sevoflurane Usp 8)

Figure6- (Sevoflurane Usp 8)
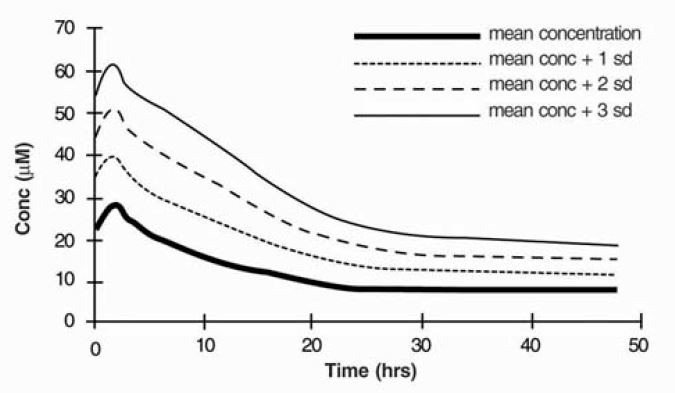
A line graph illustrating mean concentration and standard deviations over time. The x-axis represents time in hours (0 to 50), and the y-axis shows concentration in micromolar (µM) units (0 to 70). Four lines depict mean concentration, mean plus one standard deviation, mean plus two standard deviations, and mean plus three standard deviations, showing a general decline in concentration over time.*
FDA Label Image

Figure7- (Sevoflurane Usp 9)

Figure7- (Sevoflurane Usp 9)
A line graph showing heart rate (beats per minute) on the vertical axis versus MAC level on the horizontal axis, including a baseline measurement. Two data series are compared: Sevoflurane with oxygen (Sevo/O2) and Sevoflurane with oxygen and nitrous oxide (Sevo/O2/N2O), each represented by different markers with error bars. The graph illustrates changes in heart rate as MAC levels increase.*

* About these descriptions: Image descriptions on this page are generated by automated AI analysis of the product label images from the manufacturer's FDA label submission (SPL). They are provided for reference only and may contain errors or omissions. Always rely on the printed label itself and the official FDA labeling, and consult a pharmacist or healthcare professional with any questions about this product.