Figure 1 (Figure 1)
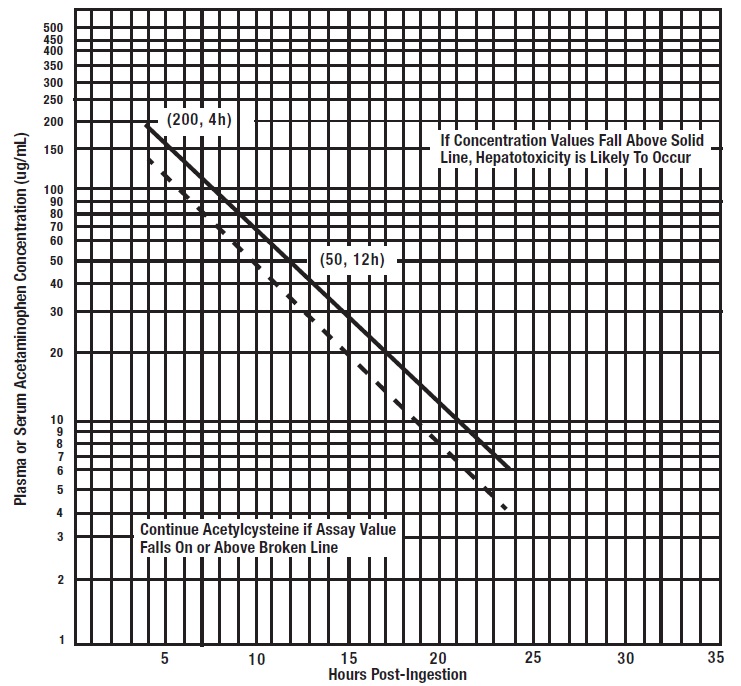
This is a visual aid for medical professionals to evaluate the likelihood of hepatotoxicity occurring based on the concentration of acetaminophen in plasma or serum, measured in ug/mL. There are two lines on the graph; if concentration values fall above the solid line, the likelihood of hepatoxicity is high, and if they fall on or above the broken line, the patient should continue acetylcysteine. The x-axis shows the hours post-ingestion and the y-axis shows the concentration values.*