Jardiance Tablet, Film Coated
Product Images NDC 0597-0152

View Photos of Packaging, Regulatory Labels, and Product Appearance

Product Visual Gallery

This gallery contains 16 technical images submitted to the FDA as part of the official labeling for Jardiance (NDC 0597-0152). Unlike standard consumer photos, these assets often include clinical data figures, molecular chemical structures, and official manufacturer packaging layouts.

As provided by Boehringer Ingelheim Pharmaceuticals, Inc., these visuals offer a comprehensive scientific overview of the product's physical and chemical identity, aiding pharmacists and researchers in product verification and study.

FDA Label Image

Chemical Structure (Jardiance 01)

Chemical Structure (Jardiance 01)
Chemical structure of Empagliflozin, the active ingredient in Jardiance tablets.*
FDA Label Image

Figure 1 (Jardiance 02)

Figure 1 (Jardiance 02)
A scatter plot comparing the geometric mean ratio (90% confidence interval) of various drugs relative to empagliflozin alone. The chart lists antidiabetic drugs like metformin, glimepiride, pioglitazone, sitagliptin, and linagliptin, plus other drugs such as simvastatin, warfarin, verapamil, ramipril, gemfibrozil, hydrochlorothiazide, torsemide, rifampicin, and probenecid. It shows AUC and Cmax values, with the x-axis indicating change relative to empagliflozin alone from 50 to 200.*
FDA Label Image

Figure 2 (Jardiance 03)

Figure 2 (Jardiance 03)
A forest plot showing the geometric mean ratio and 90% confidence interval for area under the curve (AUC) and maximum concentration (Cmax) of various drugs. The chart includes antidiabetic drugs, oral contraceptives, and other medications, with ratios centered around 100 and confidence intervals indicating variability in pharmacokinetic measures.*
FDA Label Image

Figure 3 (Jardiance 04)

Figure 3 (Jardiance 04)
A line graph showing mean percent change from baseline in HbA1c over 24 weeks for Jardiance (empagliflozin) 10 mg and 25 mg tablets compared to placebo. The x-axis represents time in weeks, and the y-axis shows HbA1c percentage change. Both empagliflozin doses demonstrate a decrease in HbA1c from baseline, whereas placebo shows minimal change.*
FDA Label Image

Figure 4 (Jardiance 05)

Figure 4 (Jardiance 05)
A line graph comparing mean percentage change from baseline in HbA1c levels over 52 weeks between two treatments: Glimepiride + Metformin (dashed line, N=700) and Empagliflozin 25 mg + Metformin (solid line, N=693). The vertical axis shows HbA1c change (%) and the horizontal axis shows time in weeks. Data points reveal trends at Baseline, Week 4, 12, 28, 40, and 52, with error bars for Week 52 mean changes.*
FDA Label Image

Figure 5 (Jardiance 06)

Figure 5 (Jardiance 06)
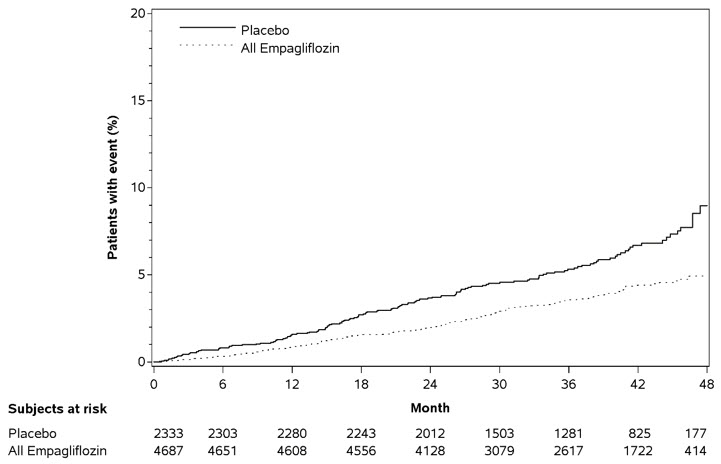
A Kaplan-Meier plot comparing the percentage of patients with an event over 48 months between placebo and all Empagliflozin treatment groups. The x-axis represents time in months, and the y-axis shows the percentage of patients with events. The graph includes a table showing the number of subjects at risk at various time points for both groups.*
FDA Label Image

Figure 6 (Jardiance 07)

Figure 6 (Jardiance 07)
A line graph showing the percentage of patients with an event over 48 months, comparing placebo and empagliflozin groups. The y-axis represents patients with event (%) and the x-axis shows months. The graph includes a risk table with subject numbers for placebo and empagliflozin at specified time points.*
FDA Label Image

Qr Code (Jardiance 08)

FDA Label Image

Jardiance 08a

Jardiance 08a
A line graph comparing the estimated cumulative incidence (%) of an outcome over days since randomization for patients receiving Empagliflozin 10 mg versus placebo. The graph shows two lines: a dotted line for Empagliflozin 10 mg and a solid line for placebo, revealing a lower incidence for Empagliflozin over approximately 810 days. Patient risk counts are noted below the x-axis at various time points.*
FDA Label Image

Jardiance 08b

Jardiance 08b
This is a Kaplan-Meier curve comparing the mean number of events over days since randomization between patients treated with Empagliflozin 10 mg and those given placebo. The graph shows that the Empagliflozin 10 mg group experienced fewer events over time compared to placebo, with hazard ratio (HR) 0.70 and significant p-value 0.0003. Patient risk numbers at various time points are also displayed.*
FDA Label Image

Jardiance 08c

Jardiance 08c
A forest plot showing hazard ratios with 95% confidence intervals for Empagliflozin 10 mg versus placebo across various subgroups (diabetes status, age, sex, race, BMI, eGFR, NYHA class, heart failure physiology, and baseline use of MRA or ARNi). The plot compares hazard ratios indicating whether Empagliflozin is better or placebo is better for each subgroup.*
FDA Label Image

Jardiance 08d

Jardiance 08d
A Kaplan-Meier curve chart depicting the estimated cumulative incidence function (%) over days since randomization for patients treated with Empagliflozin 10 mg versus placebo. The chart compares two patient groups with corresponding sample sizes and includes a hazard ratio with confidence interval and p-value for Empagliflozin 10 mg versus placebo.*
FDA Label Image

Jardiance 08e

Jardiance 08e
A line graph comparing the mean number of events over days since randomization between placebo and Empagliflozin 10 mg groups. The graph shows two curves: one for placebo and one for Empagliflozin 10 mg, with the Empagliflozin group consistently showing fewer events. The x-axis represents days since randomization, and the y-axis represents the mean number of events. The number of patients at risk for each group is listed below the x-axis.*
FDA Label Image

Jardiance 08f

Jardiance 08f
This is a forest plot chart displaying hazard ratios for various subgroups comparing Empagliflozin 10 mg with placebo. The subgroups include diabetes status, age, sex, race, BMI, eGFR, NYHA class, LVEF, NT-proBNP levels, and baseline use of mineralocorticoid receptor antagonist (MRA). Each subgroup's hazard ratio and 95% confidence interval are shown, indicating relative efficacy of Empagliflozin versus placebo.*
FDA Label Image

Principal Display Panel (10 mg Tablet Blister Pack Carton)

Principal Display Panel (10 mg Tablet Blister Pack Carton)
Jardiance 10 mg (empagliflozin tablets) packaging label showing a carton designed for 30 tablets in 3 blister cards of 10 tablets each. The label displays dosage strength, NDC 0597-0152-37, manufacturer Boehringer Ingelheim Pharmaceuticals, and includes a note that the unit dose package is not child-resistant. The label also features the Lilly logo and instructions to dispense with the enclosed medication guide.*
FDA Label Image

Principal Display Panel (25 mg Tablet Blister Pack Carton)

Principal Display Panel (25 mg Tablet Blister Pack Carton)
Jardiance 25 mg film-coated tablets packaging label showing a 30-tablet count in 3 blister cards of 10 tablets each. The label indicates empagliflozin as the active ingredient, prescription use only, and includes storage instructions and manufacturer information for Boehringer Ingelheim Pharmaceuticals, Inc. and Lilly. The package design features a white background with teal and yellow accents.*

* About these descriptions: Image descriptions on this page are generated by automated AI analysis of the product label images from the manufacturer's FDA label submission (SPL). They are provided for reference only and may contain errors or omissions. Always rely on the printed label itself and the official FDA labeling, and consult a pharmacist or healthcare professional with any questions about this product.