Praxbind Injection
Product Images NDC 0597-0197

View Photos of Packaging, Regulatory Labels, and Product Appearance

Product Visual Gallery

This gallery contains 8 technical images submitted to the FDA as part of the official labeling for Praxbind (NDC 0597-0197). Unlike standard consumer photos, these assets often include clinical data figures, molecular chemical structures, and official manufacturer packaging layouts.

As provided by Boehringer Ingelheim Pharmaceuticals, Inc., these visuals offer a comprehensive scientific overview of the product's physical and chemical identity, aiding pharmacists and researchers in product verification and study.

FDA Label Image

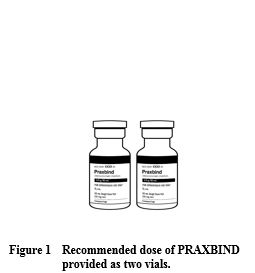
Figure-1 (Figure 1)

Figure-1 (Figure 1)
An illustration showing the recommended dose of Praxbind (idarucizumab) as provided in two vials. The image visually represents the product dose administration but does not show additional packaging or labeling details.*
FDA Label Image

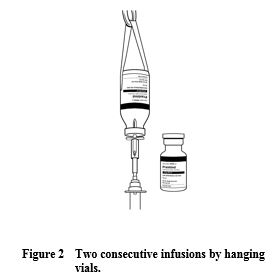
Figure-2 (Figure 2)

Figure-2 (Figure 2)
An illustration showing two consecutive intravenous infusions using hanging vials. The image depicts an infusion bag connected by tubing for IV administration alongside a vial, representing the intravenous route of administration.*
FDA Label Image

Figure-3 (Figure 3)

Figure-3 (Figure 3)
An instructional diagram showing a syringe injecting solution directly into one vial, with another vial positioned nearby, illustrating the consecutive injection of both vials via syringe for Praxbind (idarucizumab) injection 50 mg/mL, intravenous use.*
FDA Label Image

Figure-4 (Figure 4)

Figure-4 (Figure 4)
A line graph showing plasma levels of unbound dabigatran over time in healthy subjects after administration of idarucizumab or placebo. The graph displays two data series: dabigatran etexilate plus idarucizumab and dabigatran etexilate plus placebo, with time after infusion on the x-axis (hours) and unbound dabigatran concentration in ng/mL on the y-axis. An inset graph highlights the initial hours after infusion. Error bars indicate variability in measurements.*
FDA Label Image

Figure-5 (Figure 5)

Figure-5 (Figure 5)
A line graph labeled 'Change of ECT from Baseline in the Representative Group of Healthy Subjects' showing elapsed time after end of infusion (in hours) on the x-axis and ECT (seconds) on the y-axis. It compares two groups: 'Dabigatran etexilate + Idarucizumab' indicated by solid circles and a solid line, and 'Dabigatran etexilate + Placebo' indicated by open circles and a dotted line. An inset zooms in on data from -2 to 2 hours. The graph includes an 'Upper limit normal' as a dashed horizontal line. Error bars represent variability at each time point.*
FDA Label Image

Figure-6 (Figure 6)

Figure-6 (Figure 6)
A box plot chart showing the change in ECT (seconds) from baseline in 487 Dabigatran-exposed patients over time post administration of idarucizumab. Time points include Baseline, Between 10-30 min vials, 1 h, 2 h, 4 h, 12 h, and 24 h. The chart displays individual data with medians, 25th/75th and 10th/90th percentiles, 5th/95th percentiles, and an upper limit normal line.*
FDA Label Image

Figure-7 (Figure 7)

Figure-7 (Figure 7)
Box plot figure showing the change in activated partial thromboplastin time (aPTT) from baseline in 486 dabigatran-exposed patients over time after idarucizumab administration. The x-axis represents time points post-idarucizumab (baseline, 10-30 min, 1 h, 2 h, 4 h, 12 h, 24 h) and the y-axis shows aPTT in seconds. The plot includes median, interquartile ranges, and percentiles, with an indicated upper normal limit.*
FDA Label Image

Praxbind-label (Label 019705)

Praxbind-label (Label 019705)
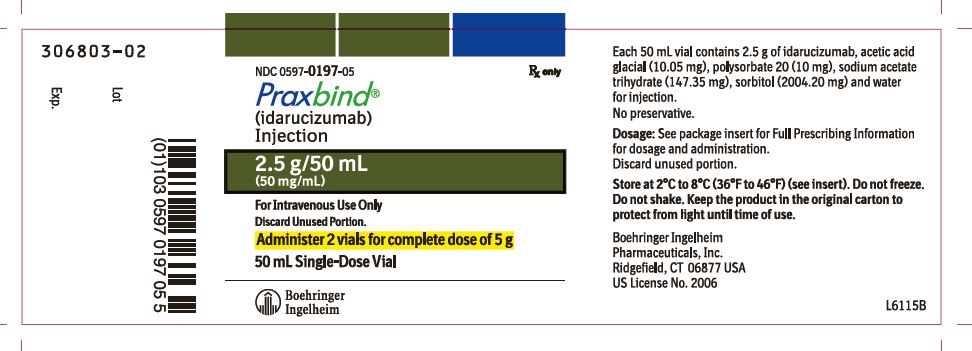
Praxbind (idarucizumab) injection label for intravenous use, strength 2.5 g/50 mL (50 mg/mL) in a 50 mL single-dose vial. The label includes dosing instructions stating to administer 2 vials for a complete dose of 5 g. It shows the Boehringer Ingelheim Pharmaceuticals, Inc. branding and storage instructions.*

* About these descriptions: Image descriptions on this page are generated by automated AI analysis of the product label images from the manufacturer's FDA label submission (SPL). They are provided for reference only and may contain errors or omissions. Always rely on the printed label itself and the official FDA labeling, and consult a pharmacist or healthcare professional with any questions about this product.