Nintedanib Capsule
Product Images NDC 0781-2492

View Photos of Packaging, Regulatory Labels, and Product Appearance

Product Visual Gallery

This gallery contains 12 technical images submitted to the FDA as part of the official labeling for Nintedanib (NDC 0781-2492). Unlike standard consumer photos, these assets often include clinical data figures, molecular chemical structures, and official manufacturer packaging layouts.

As provided by Sandoz Inc, these visuals offer a comprehensive scientific overview of the product's physical and chemical identity, aiding pharmacists and researchers in product verification and study.

FDA Label Image

Chemical-structure (Nintedanib 01)
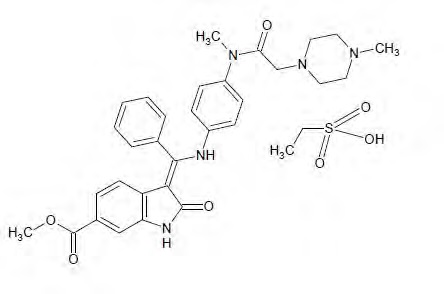
Chemical-structure (Nintedanib 01)
Chemical structure of nintedanib, an active pharmaceutical ingredient in oral capsule form. The diagram shows the molecular composition with rings and functional groups labeled by standard chemical notation.*
FDA Label Image

Figure-1 (Nintedanib 02)

Figure-1 (Nintedanib 02)
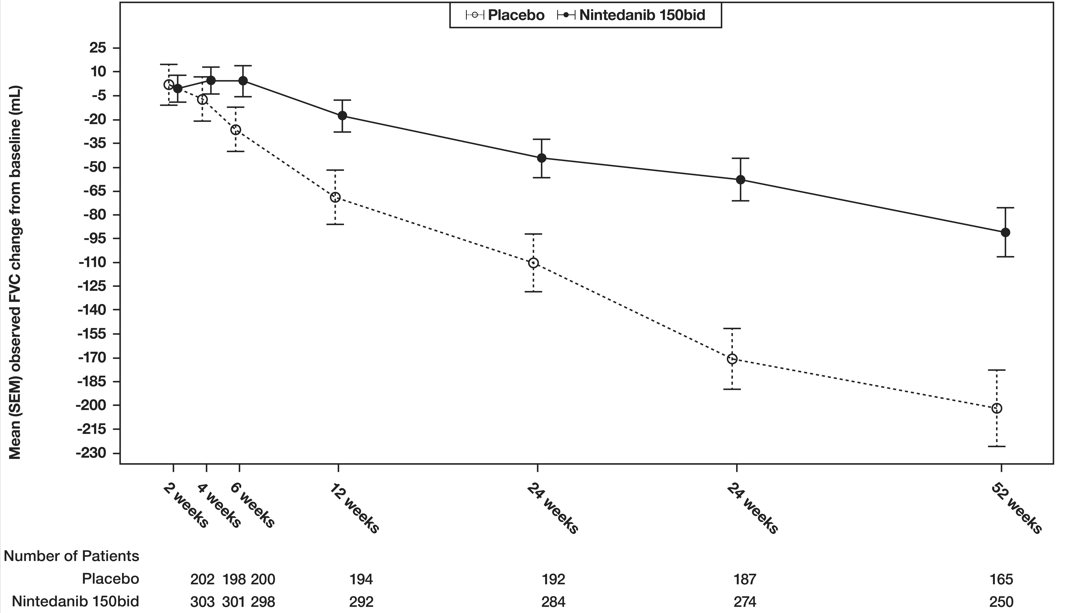
A line graph comparing the mean observed FVC change from baseline (mL) over time between Placebo and Nintedanib 150mg twice daily (bid) groups. The x-axis shows time points from 2 to 52 weeks, while the y-axis shows the mean change in FVC with error bars representing SEM. The graph includes patient numbers at each time point for both groups.*
FDA Label Image

Figure-2 (Nintedanib 03)

Figure-2 (Nintedanib 03)
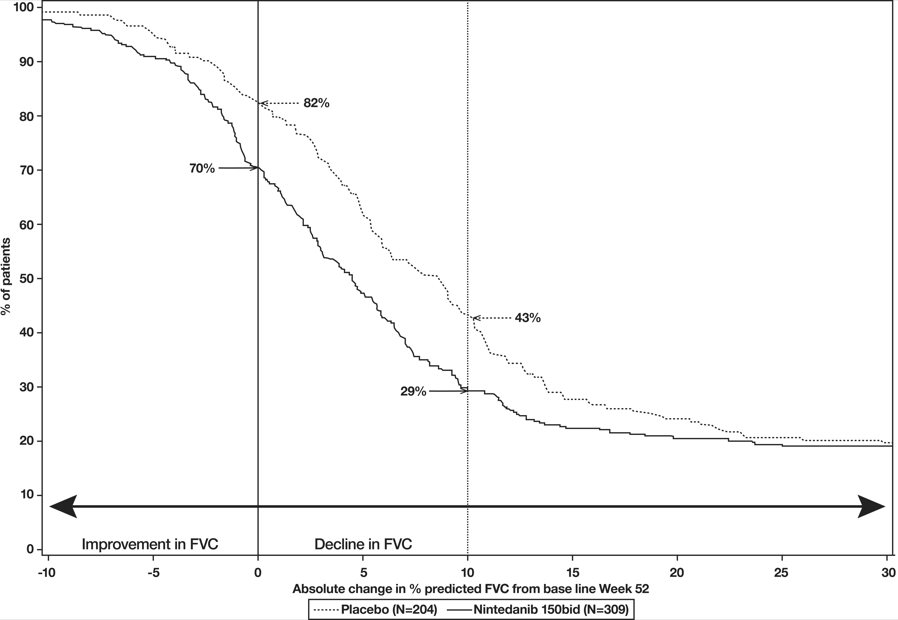
A survival curve chart depicting the percentage of patients over absolute change in percent predicted forced vital capacity (FVC) from baseline at Week 52 for two groups: Placebo (dotted line, N=204) and Nintedanib 150 mg twice daily (solid line, N=309). The x-axis shows FVC change ranging from -10% to 30%, while the y-axis shows percentage of patients from 0% to 100%. Markers highlight key patient percentages at specific FVC changes for both groups.*
FDA Label Image

Figure-3 (Nintedanib 04)

Figure-3 (Nintedanib 04)
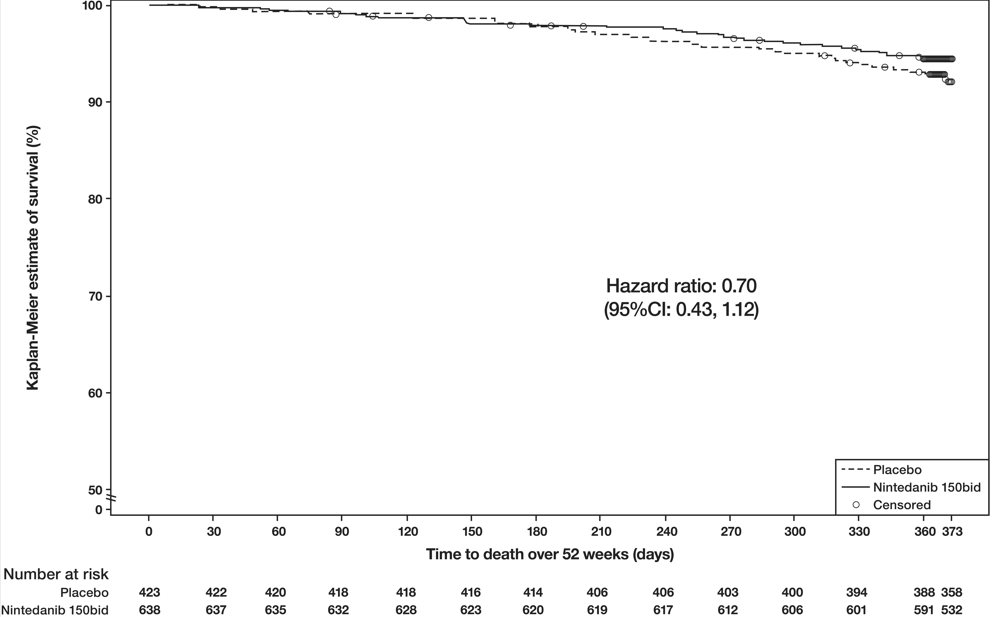
A Kaplan-Meier survival curve chart displaying the time to death over 52 weeks (days) comparing Nintedanib 150 mg twice daily (solid line) and placebo (dashed line). The vertical axis shows the Kaplan-Meier estimate of survival percentage, and the horizontal axis shows days up to 373. The chart includes censored data points and number at risk counts for both groups at various time points. The hazard ratio is 0.70 with a 95% confidence interval of 0.43 to 1.12.*
FDA Label Image

Figure-4 (Nintedanib 05)

Figure-4 (Nintedanib 05)
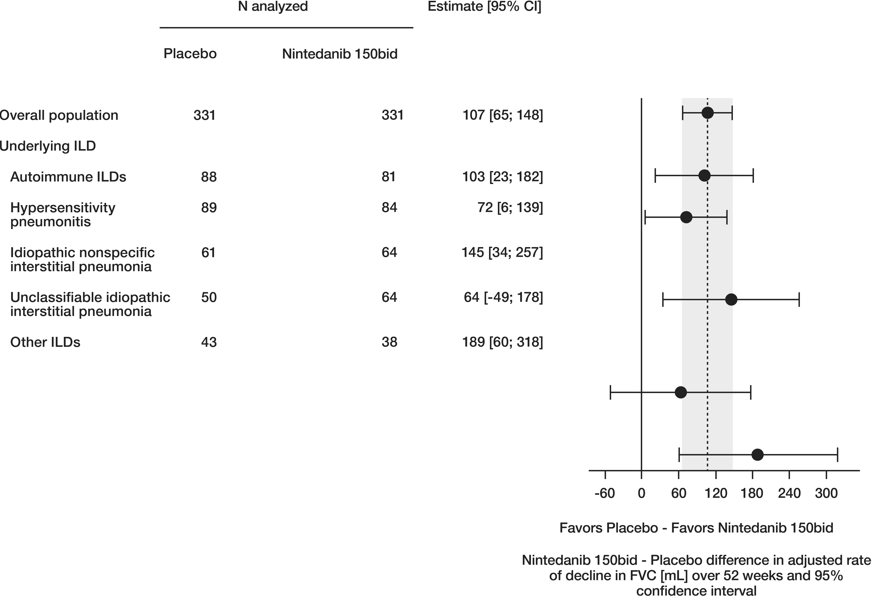
A forest plot chart comparing placebo and nintedanib 150 mg twice daily (150bid) across different interstitial lung disease (ILD) populations. The chart presents the adjusted rate of decline in forced vital capacity (FVC) over 52 weeks, with point estimates and 95% confidence intervals for overall population and ILD subgroups: autoimmune ILDs, hypersensitivity pneumonitis, idiopathic nonspecific interstitial pneumonia, unclassifiable idiopathic interstitial pneumonia, and other ILDs. The horizontal axis indicates favorability between placebo and nintedanib 150bid.*
FDA Label Image

Figure-5 (Nintedanib 06)

Figure-5 (Nintedanib 06)
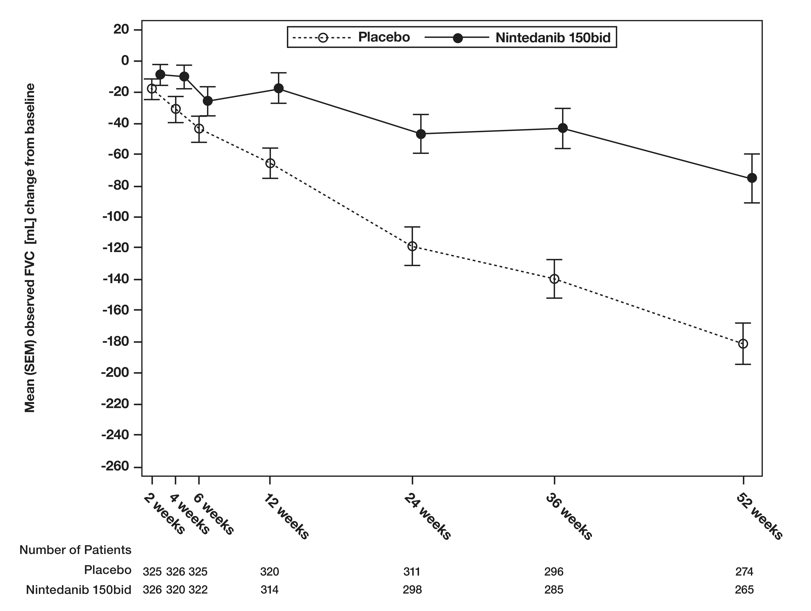
A line graph comparing mean observed FVC (mL change from baseline) over 52 weeks between placebo and Nintedanib 150 mg twice daily (150bid). The graph shows a decline in FVC for both groups, with placebo having a steeper decline. The number of patients in each group is listed below the time points.*
FDA Label Image

Figure-6 (Nintedanib 07)

Figure-6 (Nintedanib 07)
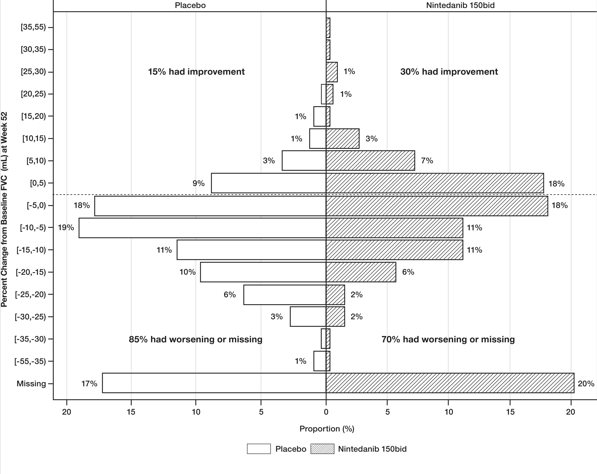
A horizontal bar chart comparing percent change from baseline FVC (mL) at Week 52 between placebo and Nintedanib 150 mg twice daily. The chart shows proportions of patients with improvement, worsening, or missing data at various percent change intervals, highlighting that 15% had improvement on placebo versus 30% on Nintedanib, and 85% had worsening or missing data on placebo compared to 70% on Nintedanib.*
FDA Label Image

Figure-7 (Nintedanib 08)

Figure-7 (Nintedanib 08)
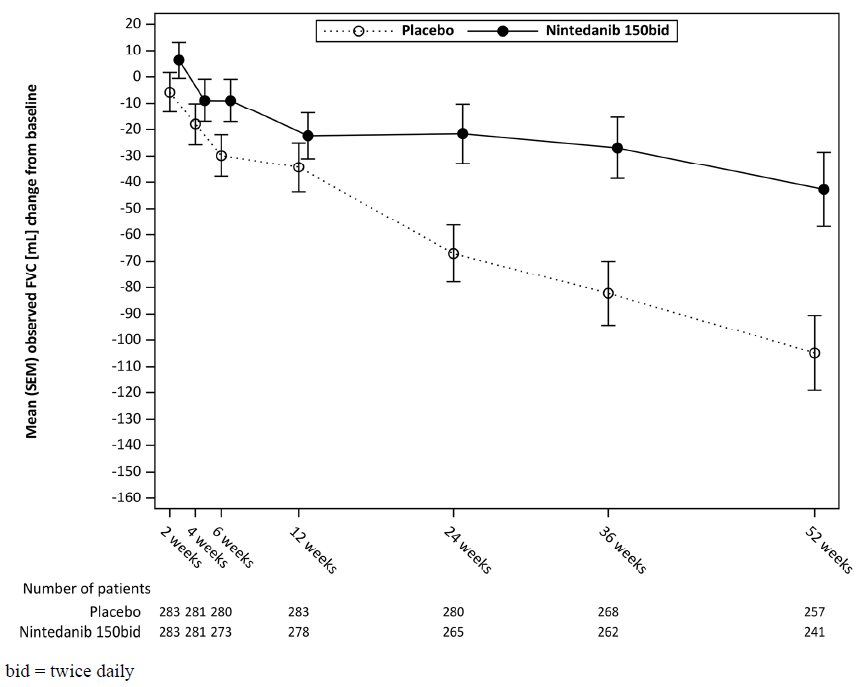
A line graph comparing the mean observed FVC (mL) change from baseline over 52 weeks between placebo and Nintedanib 150 mg twice daily in a clinical study. The x-axis represents time points from 2 to 52 weeks, and the y-axis shows mean FVC change with error bars. The graph includes patient numbers at each time point for both groups, illustrating the treatment effect over time.*
FDA Label Image

Figure-8 (Nintedanib 09)

Figure-8 (Nintedanib 09)
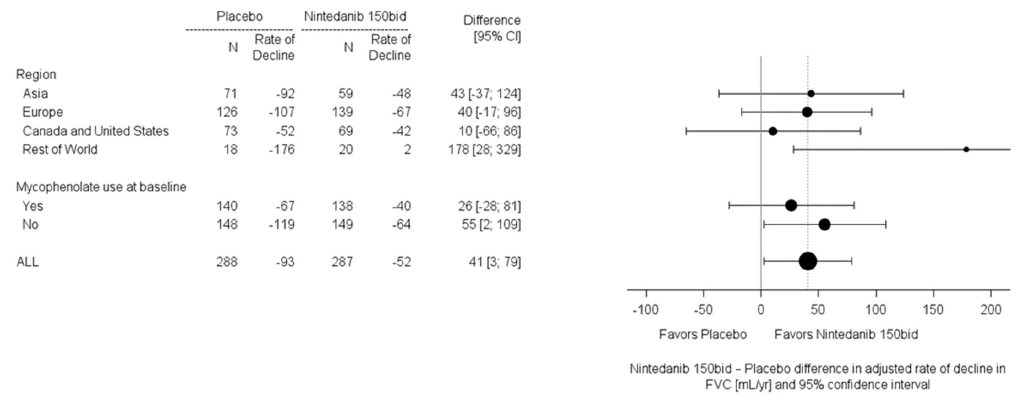
A forest plot chart comparing the adjusted rate of decline in FVC (mL/yr) between placebo and nintedanib 150 mg twice daily (150bid) across various regions and subgroups. The plot shows point estimates with 95% confidence intervals indicating differences favoring placebo or nintedanib, displaying data for Asia, Europe, Canada and United States, Rest of World, Mycophenolate use at baseline, and overall (ALL).*
FDA Label Image

Figure-9 (Nintedanib 10)

Figure-9 (Nintedanib 10)
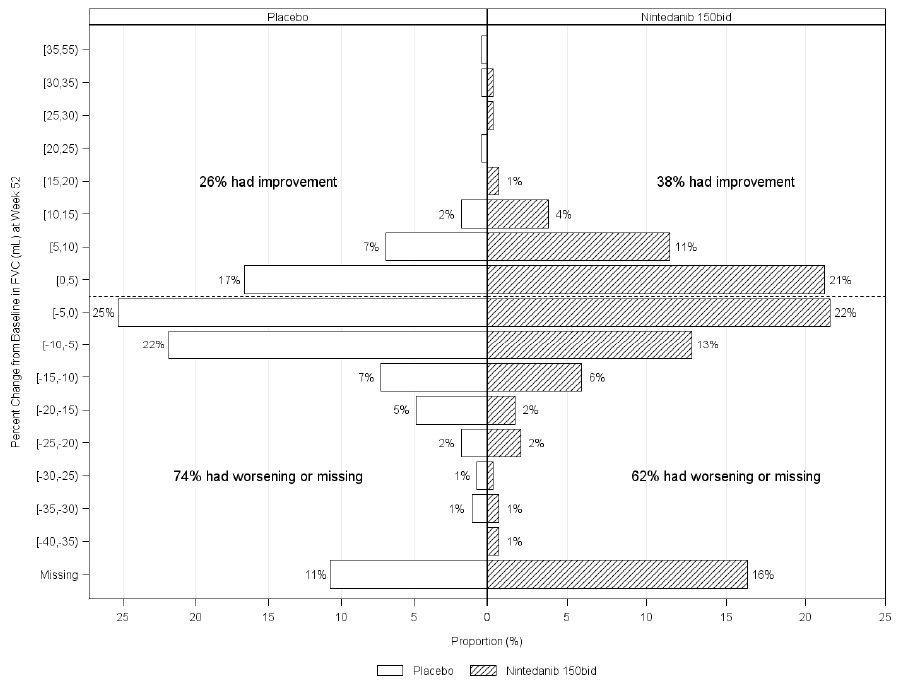
A horizontal bar chart comparing percent change from baseline in FVC (mL) at Week 52 between Placebo and Nintedanib 150 mg twice daily (bid). The chart shows proportions of patients with improvement and worsening or missing data. Placebo group had 26% improvement and 74% worsening or missing, while Nintedanib 150 bid group had 38% improvement and 62% worsening or missing. Bars are labeled with percentage values, with Nintedanib data shaded with diagonal lines.*
FDA Label Image

100mg-label (Nintedanib 11)

100mg-label (Nintedanib 11)
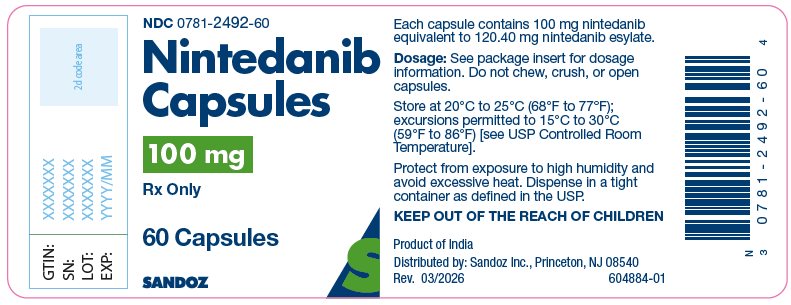
Nintedanib Capsules 100 mg oral capsule label by Sandoz Inc. The label specifies 60 capsules per bottle, prescription use only, and includes storage instructions. It notes each capsule contains 100 mg nintedanib equivalent to 120.40 mg nintedanib esylate. The label also includes warnings, batch identifiers, and a barcode.*
FDA Label Image

150mg-label (Nintedanib 12)

150mg-label (Nintedanib 12)
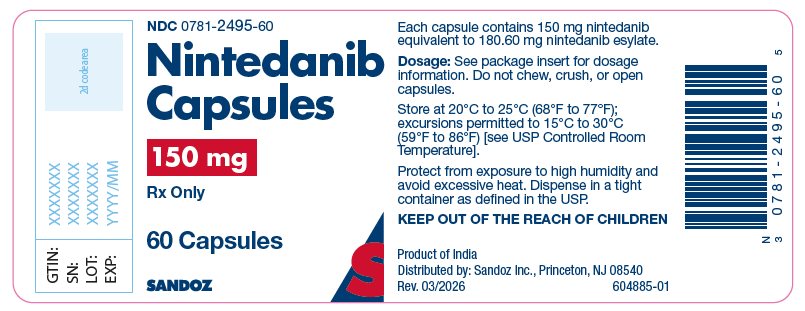
Label for Nintedanib Capsules 150 mg oral dosage form by Sandoz Inc. This package contains 60 capsules. The label includes storage instructions, warnings not to chew or open capsules, and the product origin is India. The label also provides the National Drug Code (NDC 0781-2495-60).*

* About these descriptions: Image descriptions on this page are generated by automated AI analysis of the product label images from the manufacturer's FDA label submission (SPL). They are provided for reference only and may contain errors or omissions. Always rely on the printed label itself and the official FDA labeling, and consult a pharmacist or healthcare professional with any questions about this product.