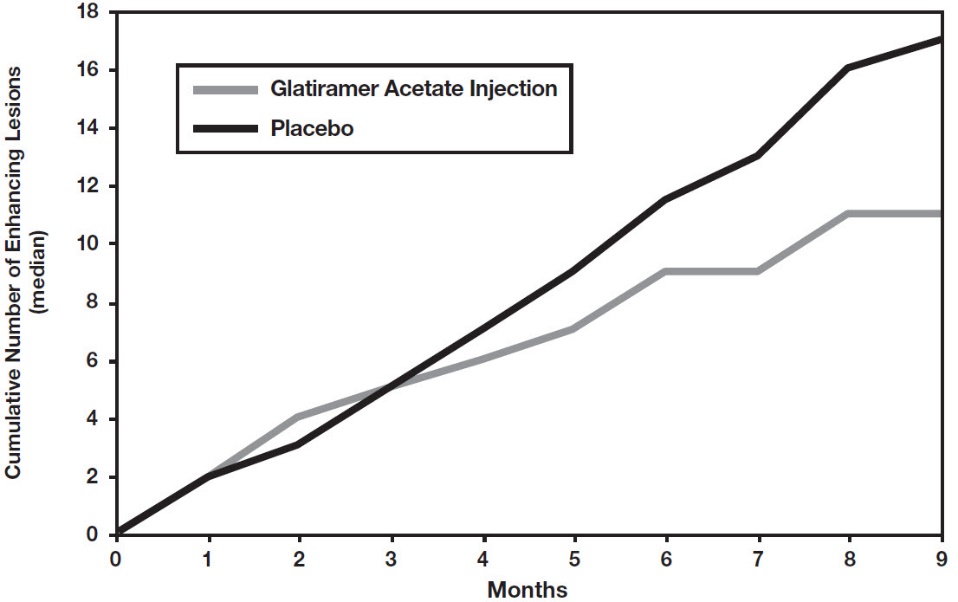
Figure_01 (Glatopa Image 01)
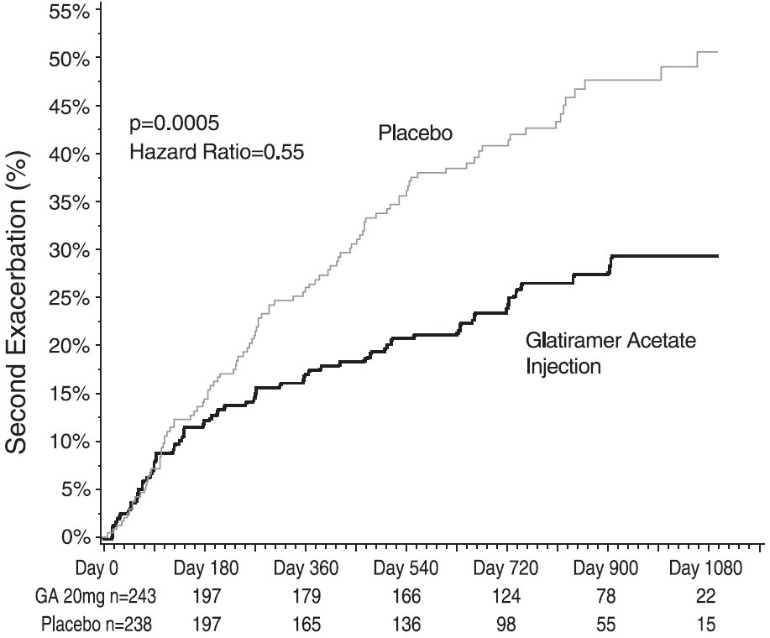
This appears to be a graph or chart displaying data related to a medication called Glatiramer Acetate Injection. The data includes percentages of exacerbation over time, comparing patients who received the medication to those who received a placebo. There is also information about hazard ratio and p-values. Without additional context or a clear image of the chart or graph, it is not possible to provide a more detailed description.*