Fulvestrant Injection
Product Images NDC 0781-3532

View Photos of Packaging, Regulatory Labels, and Product Appearance

Product Visual Gallery

This gallery contains 16 technical images submitted to the FDA as part of the official labeling for Fulvestrant (NDC 0781-3532). Unlike standard consumer photos, these assets often include clinical data figures, molecular chemical structures, and official manufacturer packaging layouts.

As provided by Sandoz Inc, these visuals offer a comprehensive scientific overview of the product's physical and chemical identity, aiding pharmacists and researchers in product verification and study.

FDA Label Image

Figure-1 (Fulvestrant Sdz Room 01)
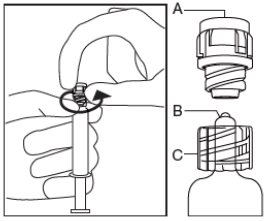
Figure-1 (Fulvestrant Sdz Room 01)
An instructional diagram showing the removal of a cap or closure from a vial or syringe. The first part shows a hand twisting the top (labeled A), and the second and third close-up views (labeled B and C) demonstrate the top component from different angles, highlighting details of the cap or needle cover.*
FDA Label Image

Figure-2 (Fulvestrant Sdz Room 02)

Figure-2 (Fulvestrant Sdz Room 02)
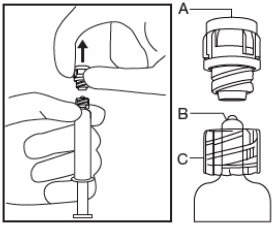
An instructional illustration demonstrating how to prepare an intramuscular injection using a syringe and vial. It includes a step showing the removal of the vial cap, with close-up views labeled A, B, and C highlighting details of the vial cap and its removal process.*
FDA Label Image

Figure 3.jpg (Fulvestrant Sdz Room 03)

Figure 3.jpg (Fulvestrant Sdz Room 03)
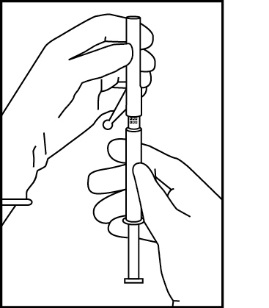
A black-and-white illustration showing two hands preparing an injection. One hand holds a syringe while the other hand is attaching or removing a needle cap, demonstrating part of the injection preparation process for an intramuscular drug.*
FDA Label Image

Figure 4.jpg (Fulvestrant Sdz Room 04)

Figure 4.jpg (Fulvestrant Sdz Room 04)
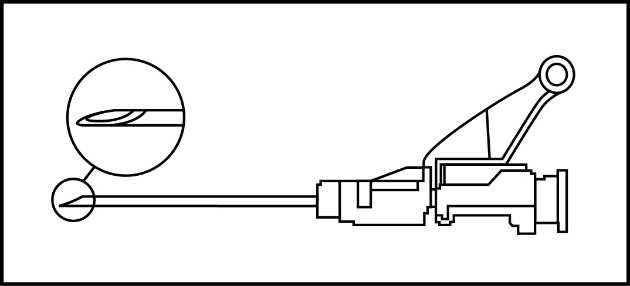
A black and white line drawing showing a detailed cross-sectional view of an injection device with a focus on the needle tip. The diagram highlights the internal mechanism and sharp tip of the needle used for administering the drug intramuscularly.*
FDA Label Image

Figure 5.jpg (Fulvestrant Sdz Room 05)

Figure 5.jpg (Fulvestrant Sdz Room 05)
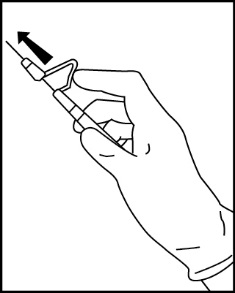
An instructional diagram showing a hand wearing a glove holding a syringe with a safety cap. The image illustrates the removal of the syringe cap by pulling it upward. This likely demonstrates a step in preparation for an intramuscular injection.*
FDA Label Image

Structural Formula (Fulvestrant Sdz Room 06)

Structural Formula (Fulvestrant Sdz Room 06)
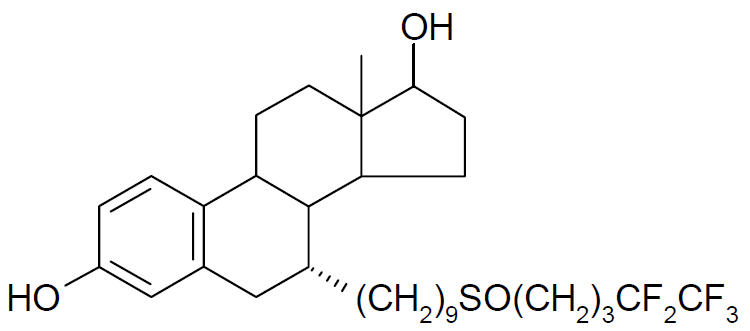
Chemical structure diagram of fulvestrant, showing its molecular framework including hydroxyl groups and fluorinated alkyl side chains.*
FDA Label Image

Figure 6.jpg (Fulvestrant Sdz Room 07)

Figure 6.jpg (Fulvestrant Sdz Room 07)
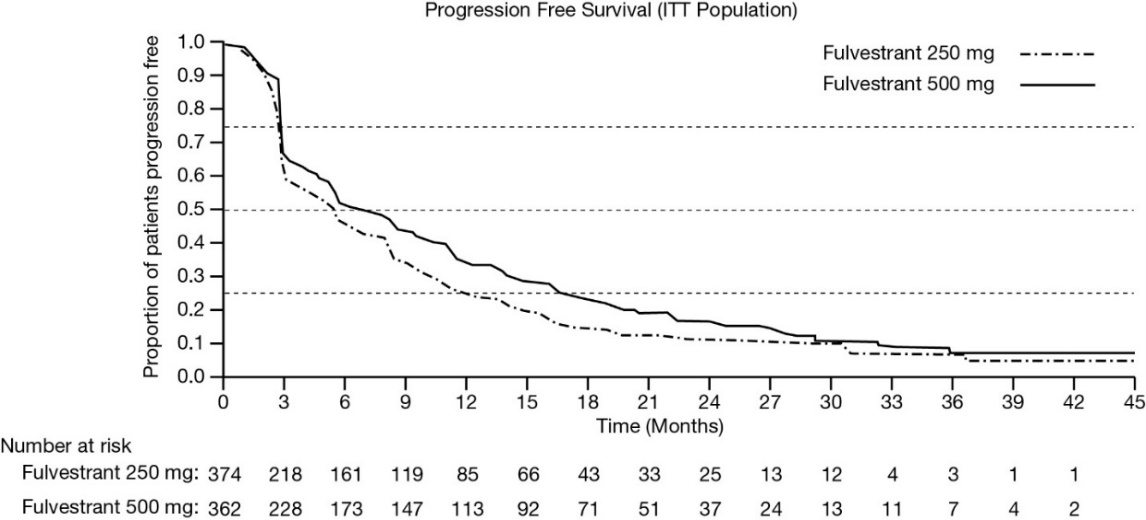
A Kaplan-Meier progression free survival graph for Fulvestrant showing two dosage groups, 250 mg and 500 mg, over a 45-month period. The y-axis represents the proportion of patients progression free, and the x-axis is time in months. The graph compares survival rates between the two dosages for an ITT (intention-to-treat) population.*
FDA Label Image

Figure 7.jpg (Fulvestrant Sdz Room 08)

Figure 7.jpg (Fulvestrant Sdz Room 08)
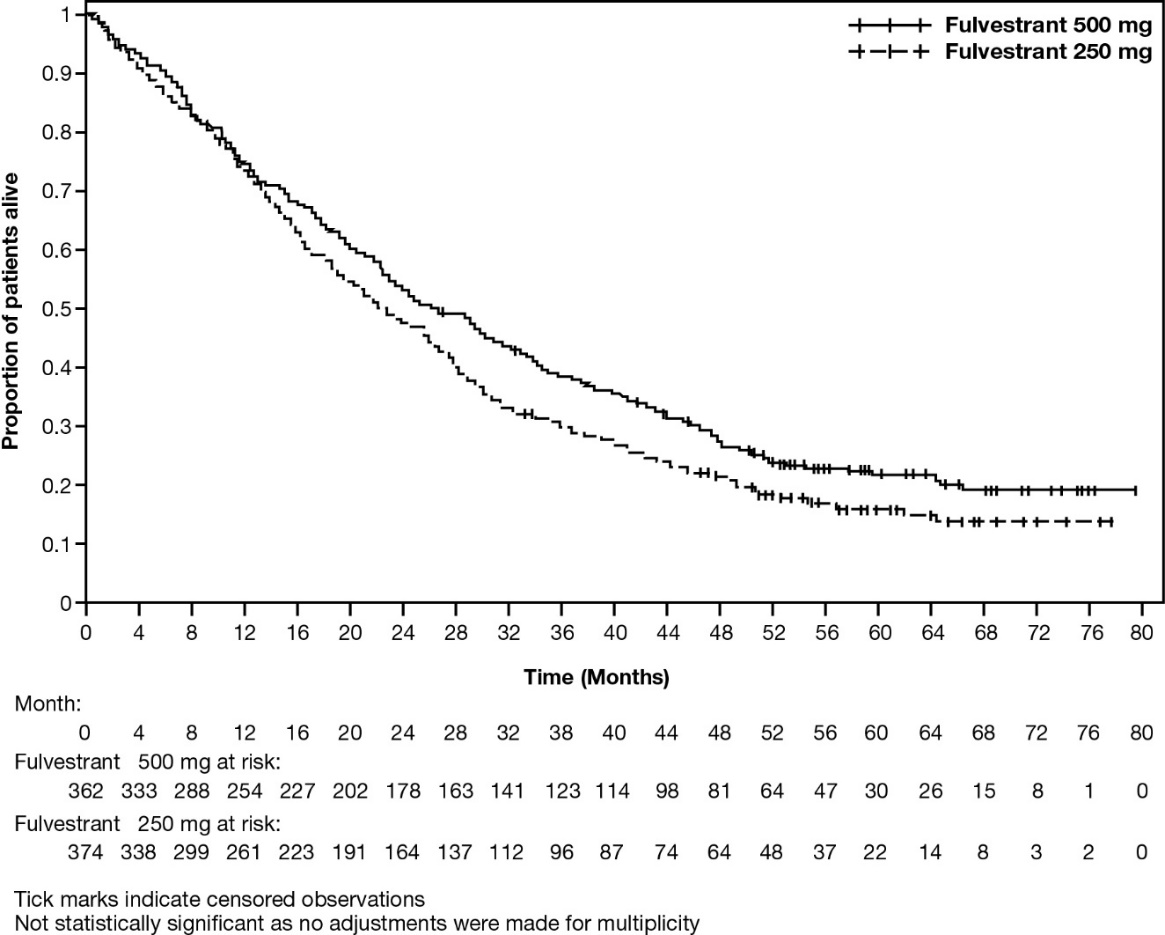
A Kaplan-Meier survival curve chart showing the proportion of patients alive over time (months) for two doses of Fulvestrant injection: 250 mg and 500 mg. The y-axis represents the proportion of patients alive, and the x-axis shows time in months. The chart includes tick marks for censored observations and a table below indicating numbers at risk for each dose at various time points up to 80 months.*
FDA Label Image

Figure 8.jpg (Fulvestrant Sdz Room 09)

Figure 8.jpg (Fulvestrant Sdz Room 09)
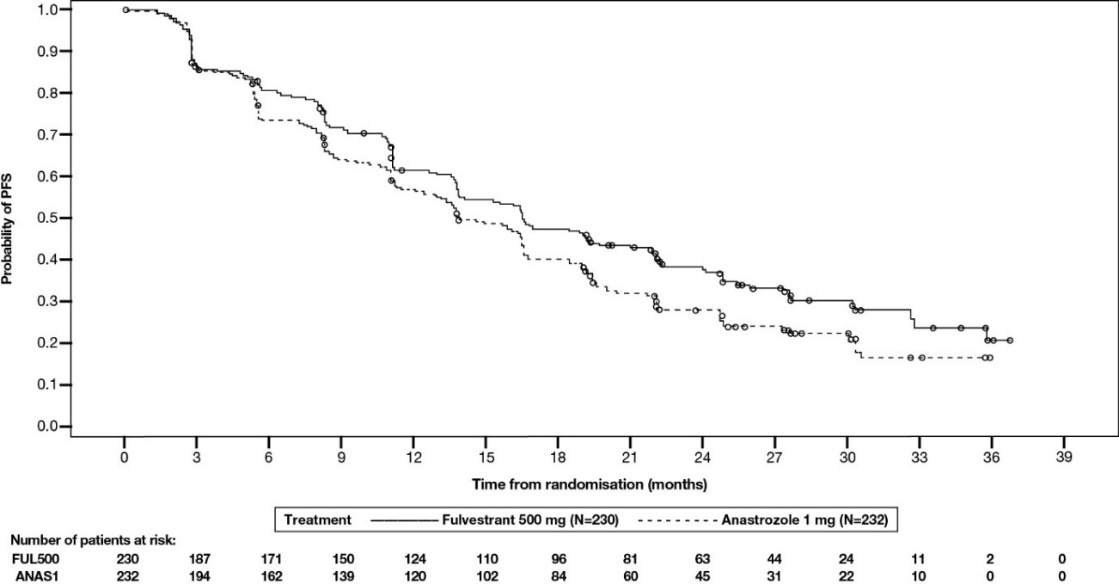
A Kaplan-Meier survival curve comparing the probability of progression-free survival (PFS) over time in months for two treatments: Fulvestrant 500 mg (N=230) and Anastrozole 1 mg (N=232). The graph shows PFS probability on the vertical axis and time from randomization on the horizontal axis, with patient numbers at risk listed below for each time point.*
FDA Label Image

Figure-9 (Fulvestrant Sdz Room 10)

Figure-9 (Fulvestrant Sdz Room 10)
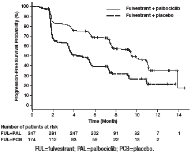
A Kaplan-Meier survival curve chart comparing Fulvestrant injection 50 mg/mL plus placebo versus placebo alone over 14 months. The y-axis shows the percentage of patients with no disease progression, ranging from 0 to 100%. The x-axis represents time in months. Two curves depict the progression-free survival rates for the two groups across the study period, with patient numbers at risk provided below the x-axis at specific time points.*
FDA Label Image

Figure-10 (Fulvestrant Sdz Room 11)

Figure-10 (Fulvestrant Sdz Room 11)
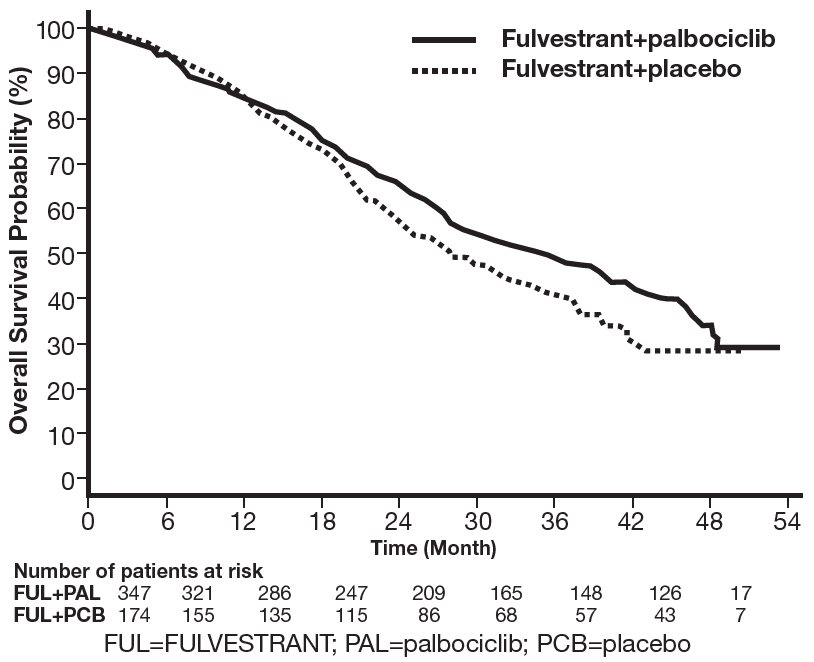
This is a Kaplan-Meier overall survival probability curve comparing Fulvestrant plus palbociclib versus Fulvestrant plus placebo treatments over 54 months. The y-axis represents overall survival probability as a percentage, and the x-axis shows time in months. The chart includes numbers of patients at risk over time for both treatment groups.*
FDA Label Image

Figure 11.jpg (Fulvestrant Sdz Room 12)

Figure 11.jpg (Fulvestrant Sdz Room 12)
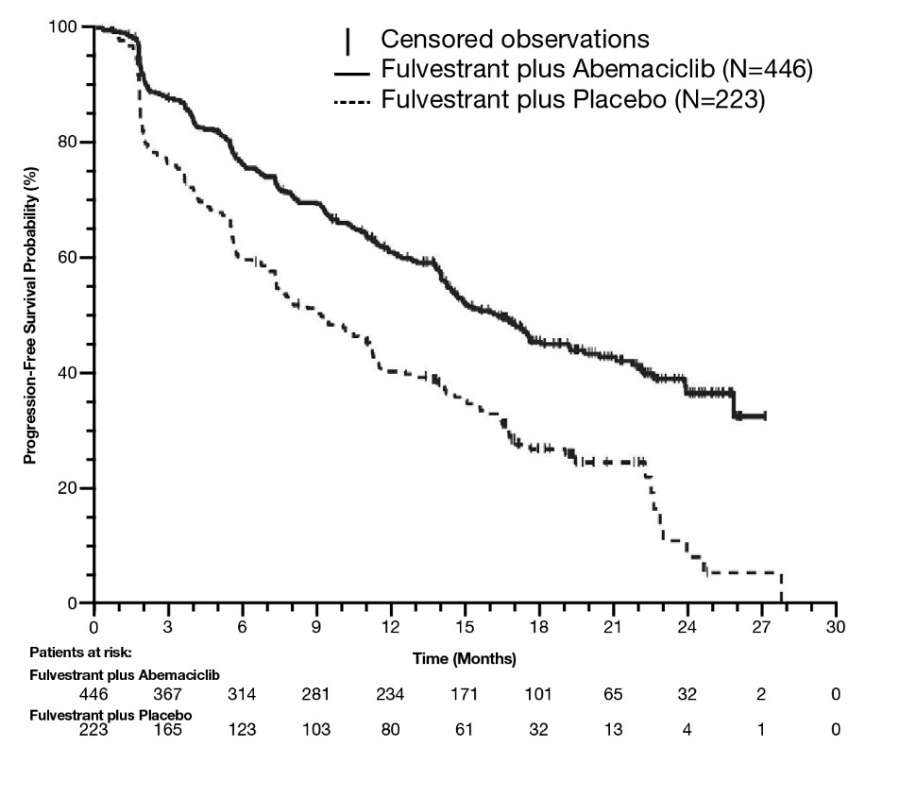
A Kaplan-Meier survival curve graph displaying progression-free survival probability (%) over time in months for two groups: Fulvestrant plus Abemaciclib (solid line) and Fulvestrant plus Placebo (dashed line). The graph includes censored observations and a table of patients at risk at various time points up to 30 months.*
FDA Label Image

Figure 12.jpg (Fulvestrant Sdz Room 13)

Figure 12.jpg (Fulvestrant Sdz Room 13)
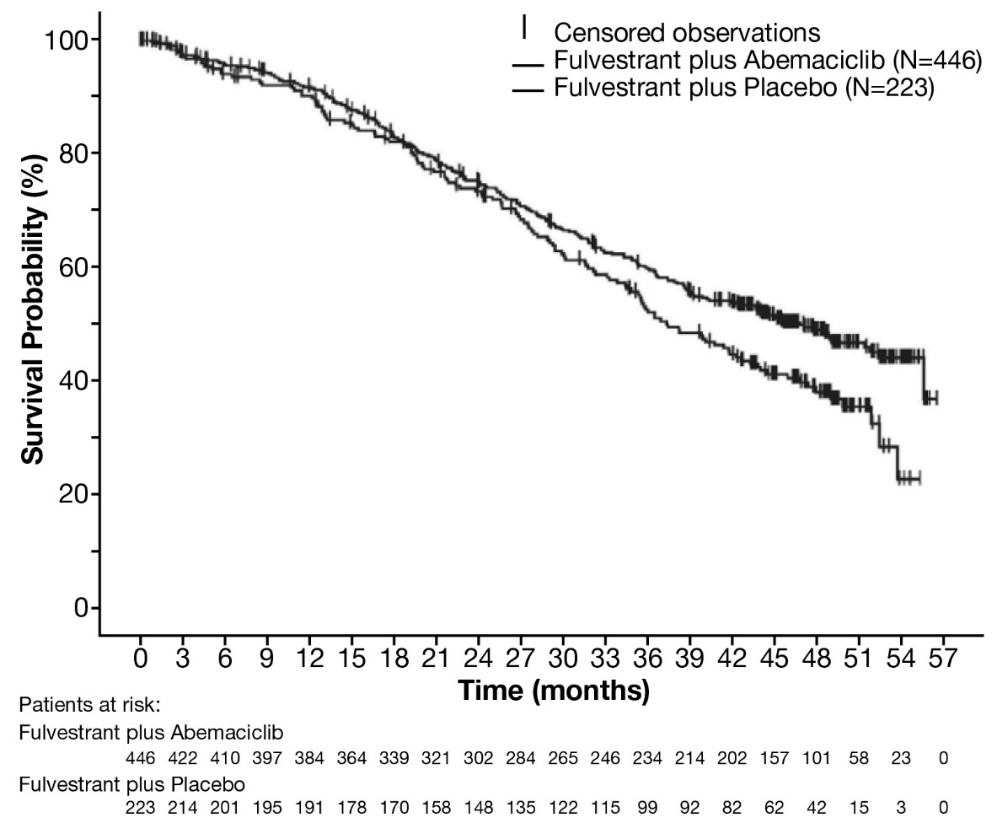
A Kaplan-Meier survival probability chart comparing Fulvestrant plus Abemaciclib versus Fulvestrant plus Placebo over a 57-month period. The y-axis represents survival probability (%) and the x-axis represents time in months. The chart includes numbers of patients at risk for both groups at various time points, along with censored observations indicated on the survival curves.*
FDA Label Image

Fig_13.jpg (Fulvestrant Sdz Room 14)

Fig_13.jpg (Fulvestrant Sdz Room 14)
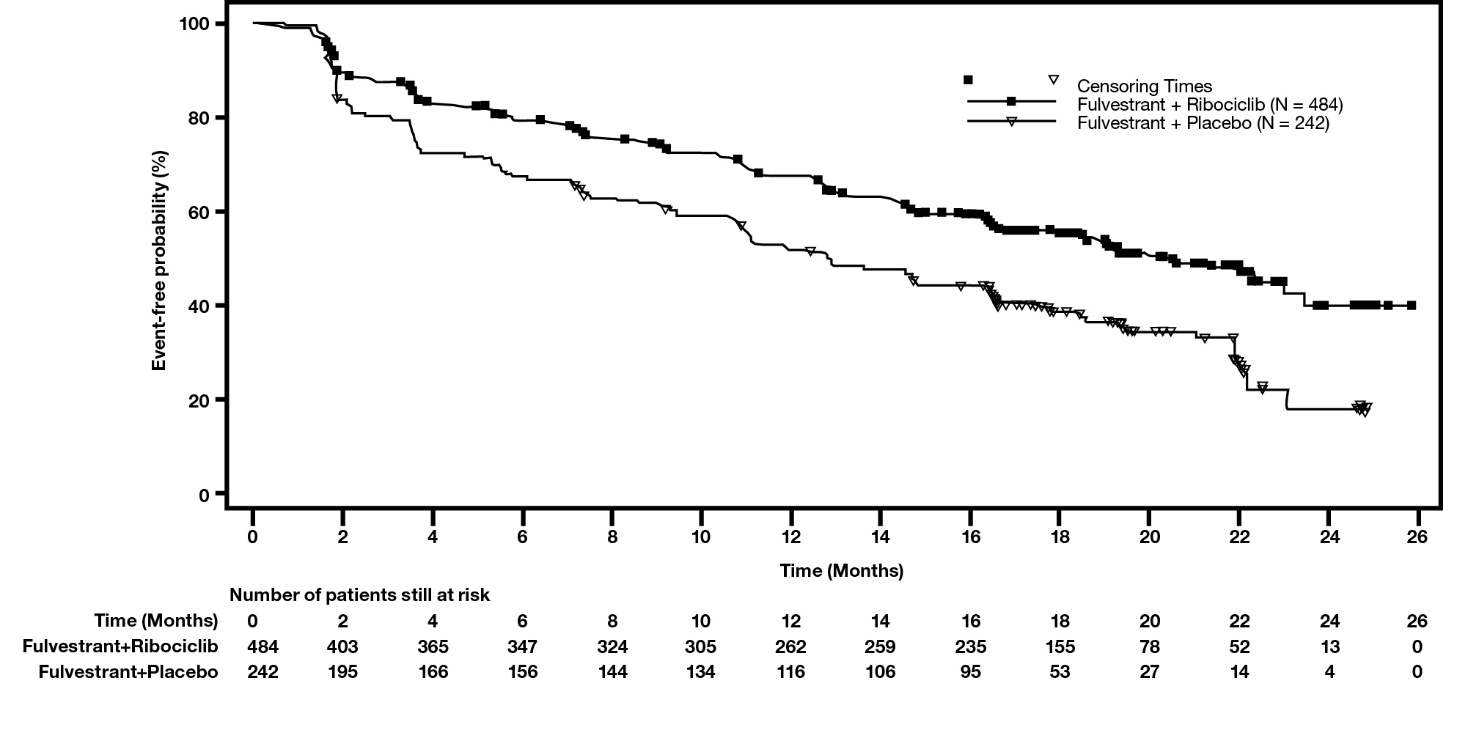
A Kaplan-Meier plot showing event-free probability (%) over 26 months comparing Fulvestrant combined with Ribociclib versus Fulvestrant combined with Placebo in patients. The graph includes censoring times and a table displaying the number of patients still at risk at different time points for both treatment groups.*
FDA Label Image

Fig_14.jpg (Fulvestrant Sdz Room 15)

Fig_14.jpg (Fulvestrant Sdz Room 15)
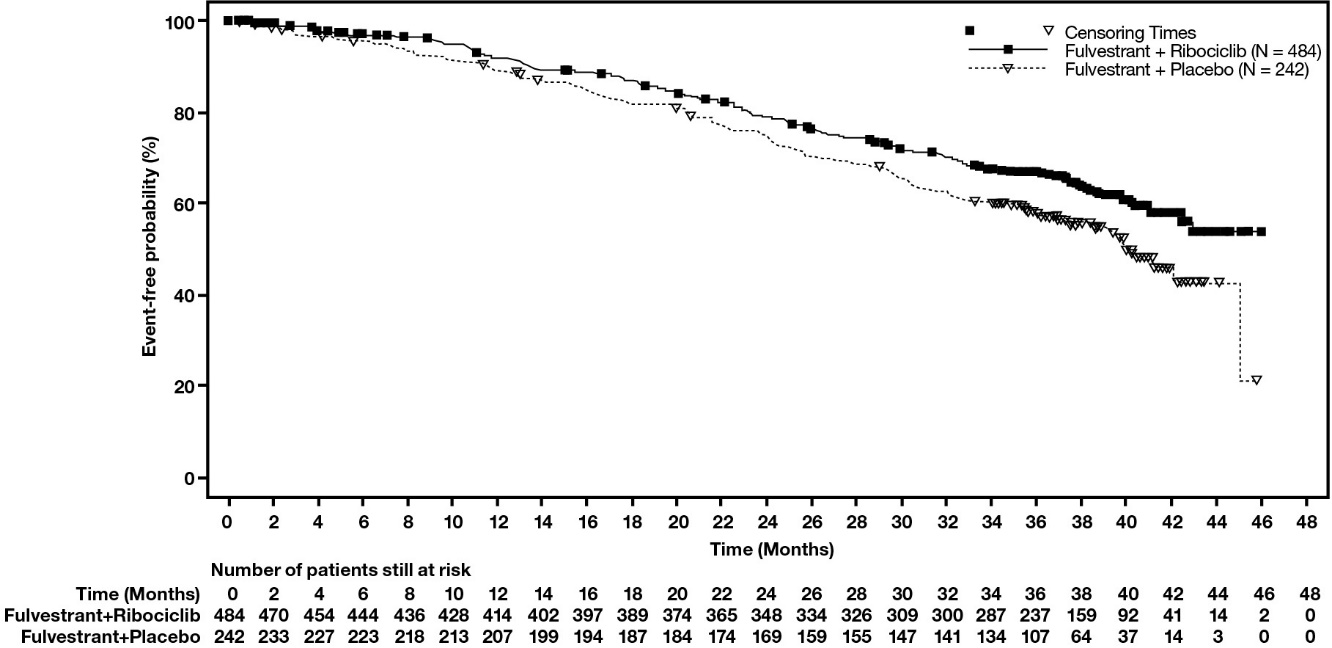
A Kaplan-Meier curve showing event-free probability (%) over time (months) for two groups: Fulvestrant plus Ribociclib (484 patients) and Fulvestrant plus Placebo (242 patients). The chart includes censoring times and a table below indicating the number of patients still at risk at various time points up to 48 months.*
FDA Label Image

Carton (Image 01)

Carton (Image 01)
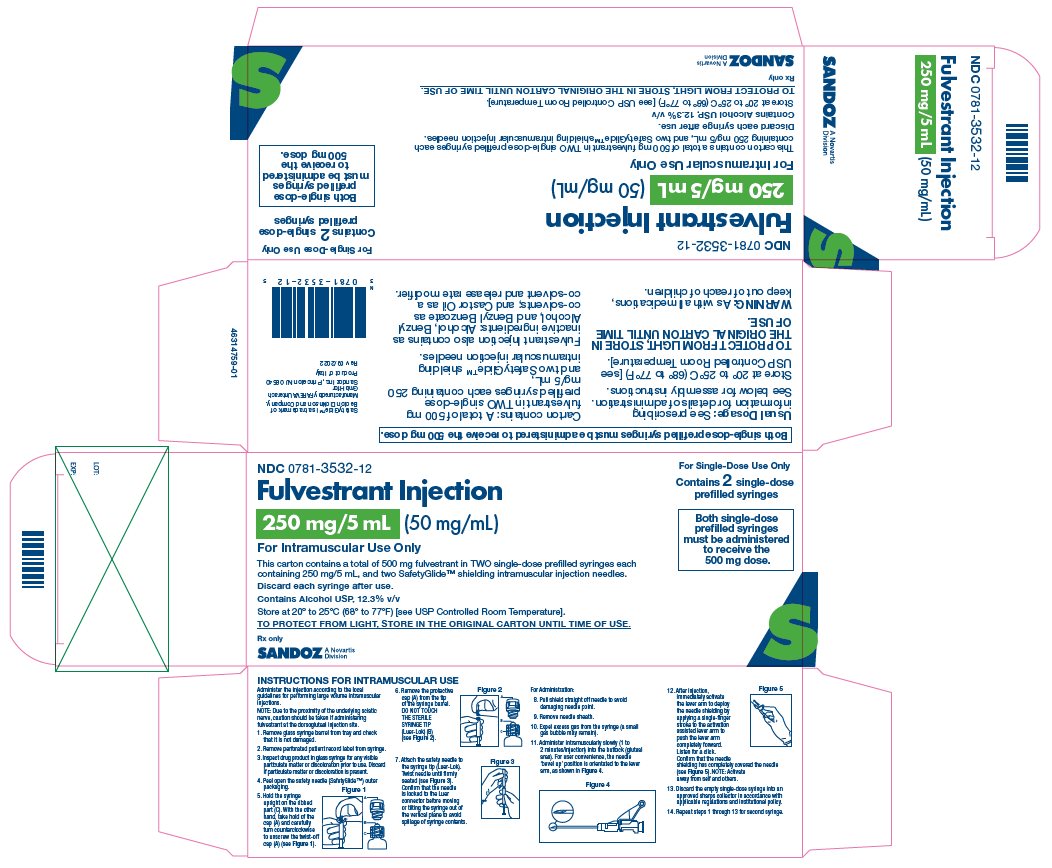
Fulvestrant Injection 250 mg/5 mL (50 mg/mL) in a carton label by Sandoz Inc. The label indicates the drug is for intramuscular use only and contains two single-dose prefilled syringes, each with 250 mg/5 mL. Instructions for intramuscular use are included, along with storage and handling details. The label emphasizes protecting from light and storing at controlled room temperature.*

* About these descriptions: Image descriptions on this page are generated by automated AI analysis of the product label images from the manufacturer's FDA label submission (SPL). They are provided for reference only and may contain errors or omissions. Always rely on the printed label itself and the official FDA labeling, and consult a pharmacist or healthcare professional with any questions about this product.