Macitentan Tablet, Film Coated
Product Images NDC 0781-8135

View Photos of Packaging, Regulatory Labels, and Product Appearance

Product Visual Gallery

This gallery contains 6 technical images submitted to the FDA as part of the official labeling for Macitentan (NDC 0781-8135). Unlike standard consumer photos, these assets often include clinical data figures, molecular chemical structures, and official manufacturer packaging layouts.

As provided by Sandoz Inc, these visuals offer a comprehensive scientific overview of the product's physical and chemical identity, aiding pharmacists and researchers in product verification and study.

FDA Label Image

Macitentan-10mg-30s-container-label (Macitentan 10mg 30s Container Label)
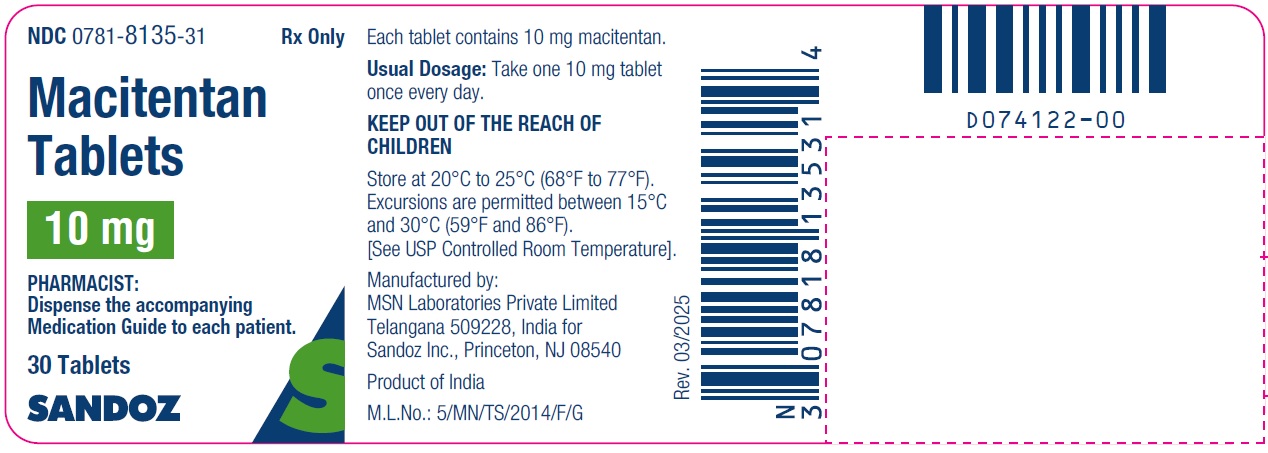
Macitentan-10mg-30s-container-label (Macitentan 10mg 30s Container Label)
Label for Macitentan Tablets 10 mg film-coated oral tablets by Sandoz Inc. The label indicates a package size of 30 tablets, with storage instructions between 20°C to 25°C (68°F to 77°F) and permissible excursions. Manufactured by MSN Laboratories Private Limited, India, for Sandoz Inc., Princeton, NJ.*
FDA Label Image

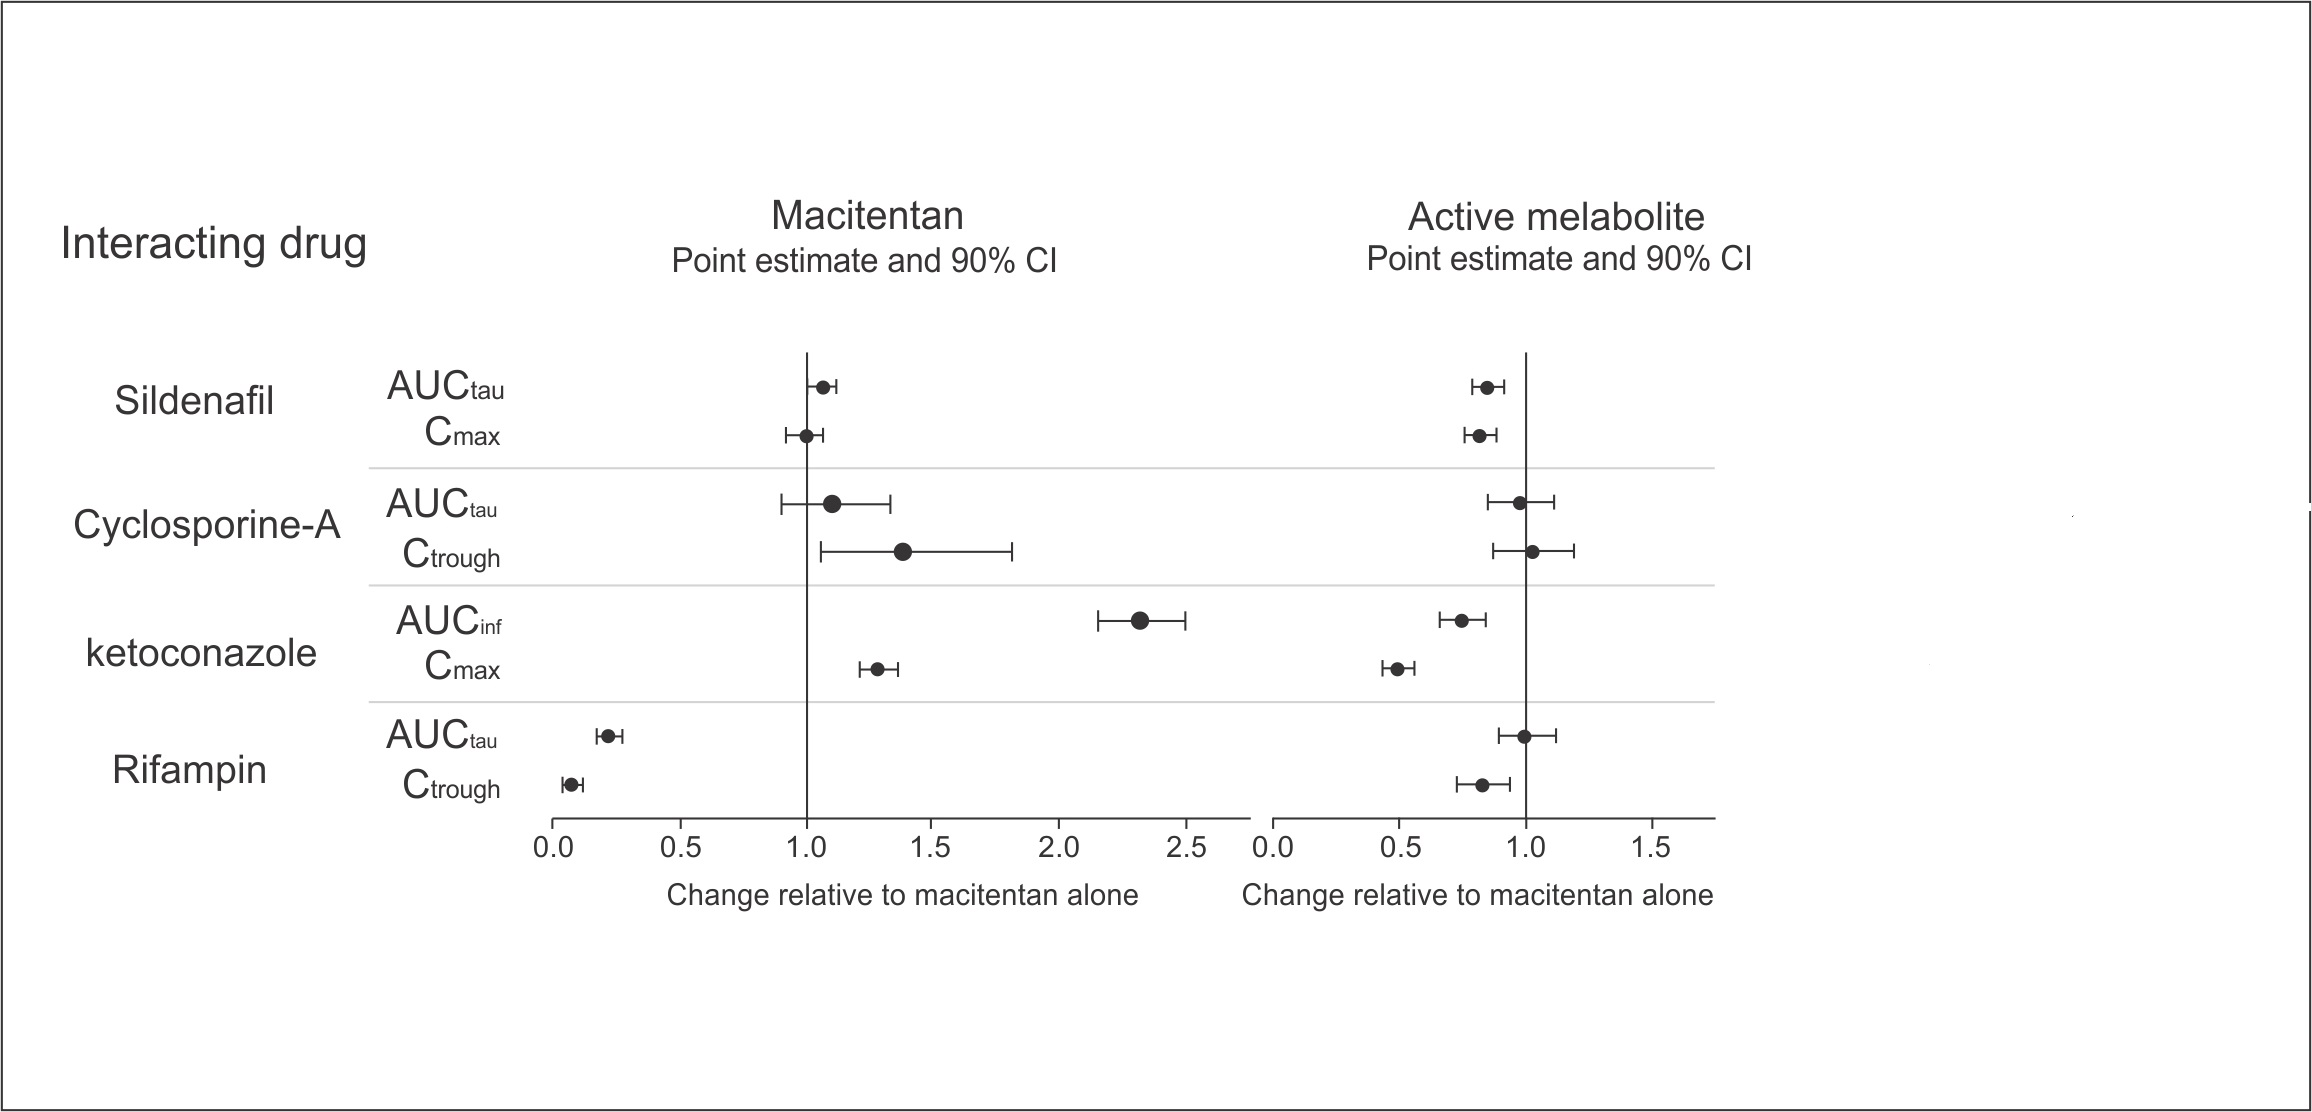
Macitentan-figure-01 (Macitentan Figure 01)

Macitentan-figure-01 (Macitentan Figure 01)
A forest plot chart comparing the effects of interacting drugs (Sildenafil, Cyclosporine-A, Ketoconazole, and Rifampin) on macitentan and its active metabolite. The chart shows point estimates with 90% confidence intervals for pharmacokinetic parameters (AUC and Cmax/Ctrough) indicating changes relative to macitentan alone.*
FDA Label Image

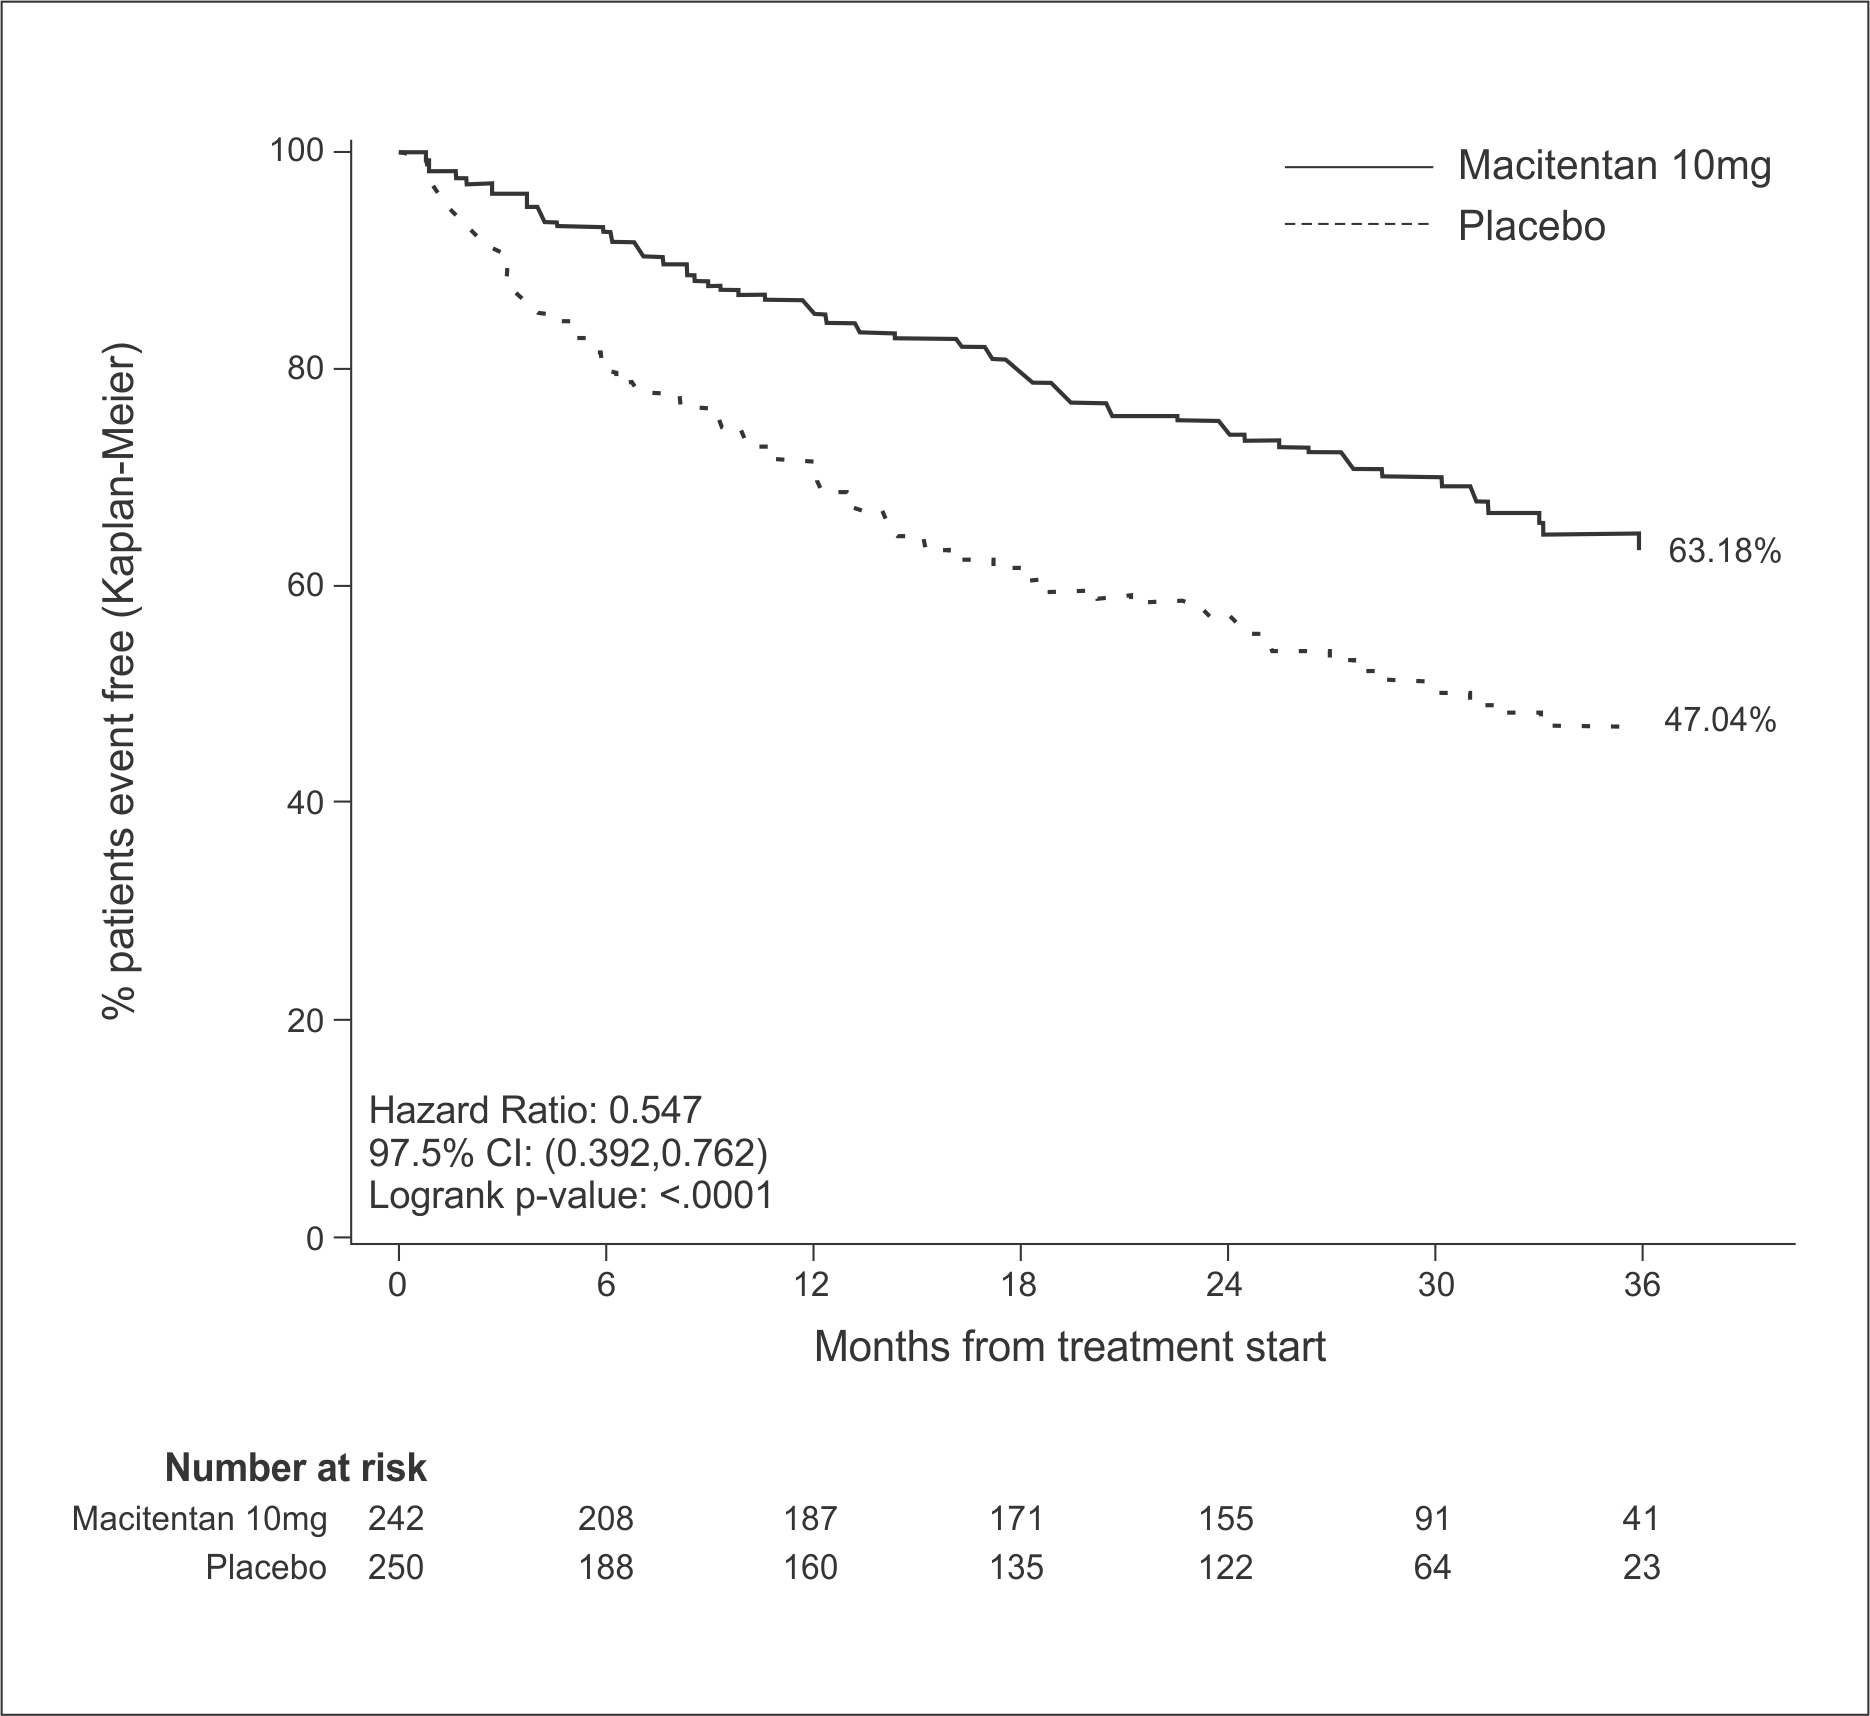
Figure-02 (Macitentan Figure 02)

Figure-02 (Macitentan Figure 02)
Kaplan-Meier survival curve showing the percentage of patients event-free over months from treatment start. The solid line represents macitentan 10 mg and the dotted line represents placebo. Macitentan 10 mg shows 63.18% event-free patients compared to 47.04% for placebo at the end of the observed period.*
FDA Label Image

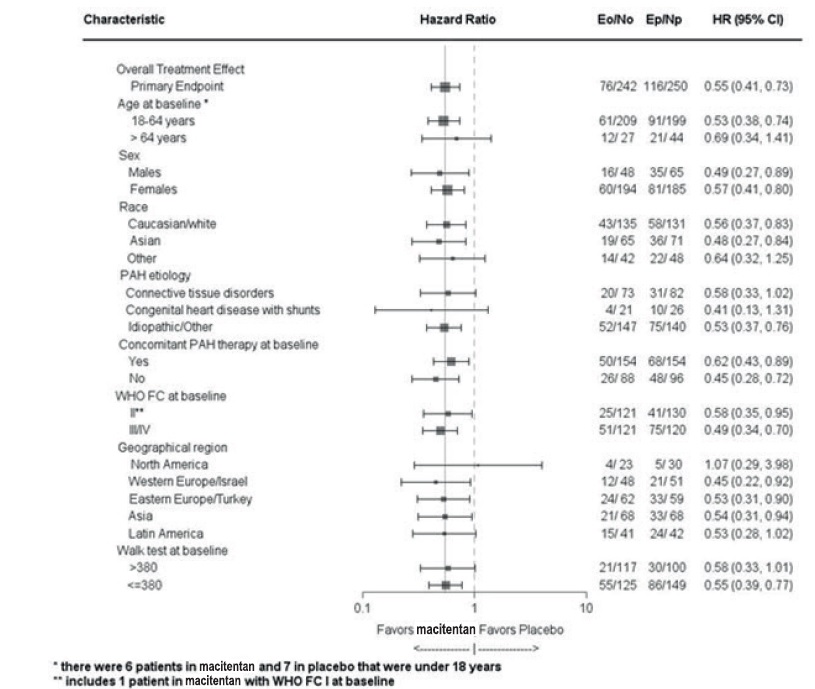
Macitentan-figure-03 (Macitentan Figure 03)

Macitentan-figure-03 (Macitentan Figure 03)
A forest plot showing hazard ratios with 95% confidence intervals comparing macitentan to placebo across various patient characteristics such as age, sex, race, PAH etiology, concomitant PAH therapy, WHO functional class, geographical region, and baseline walk test distance. The plot indicates hazard ratios on a logarithmic scale, with the majority favoring macitentan over placebo.*
FDA Label Image

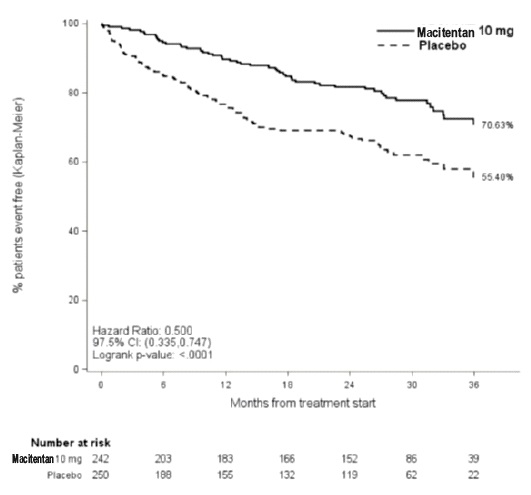
Fig-04 (Macitentan Figure 04)

Fig-04 (Macitentan Figure 04)
Kaplan-Meier survival curve comparing the percentage of patients event-free over time for Macitentan 10 mg tablets versus placebo. The x-axis shows months from treatment start up to 36 months, and the y-axis shows the percentage of patients event-free. The curve for Macitentan 10 mg remains higher than placebo, ending around 70.63%, versus 55.40% for placebo. Number of patients at risk is shown below the graph at different time points.*
FDA Label Image

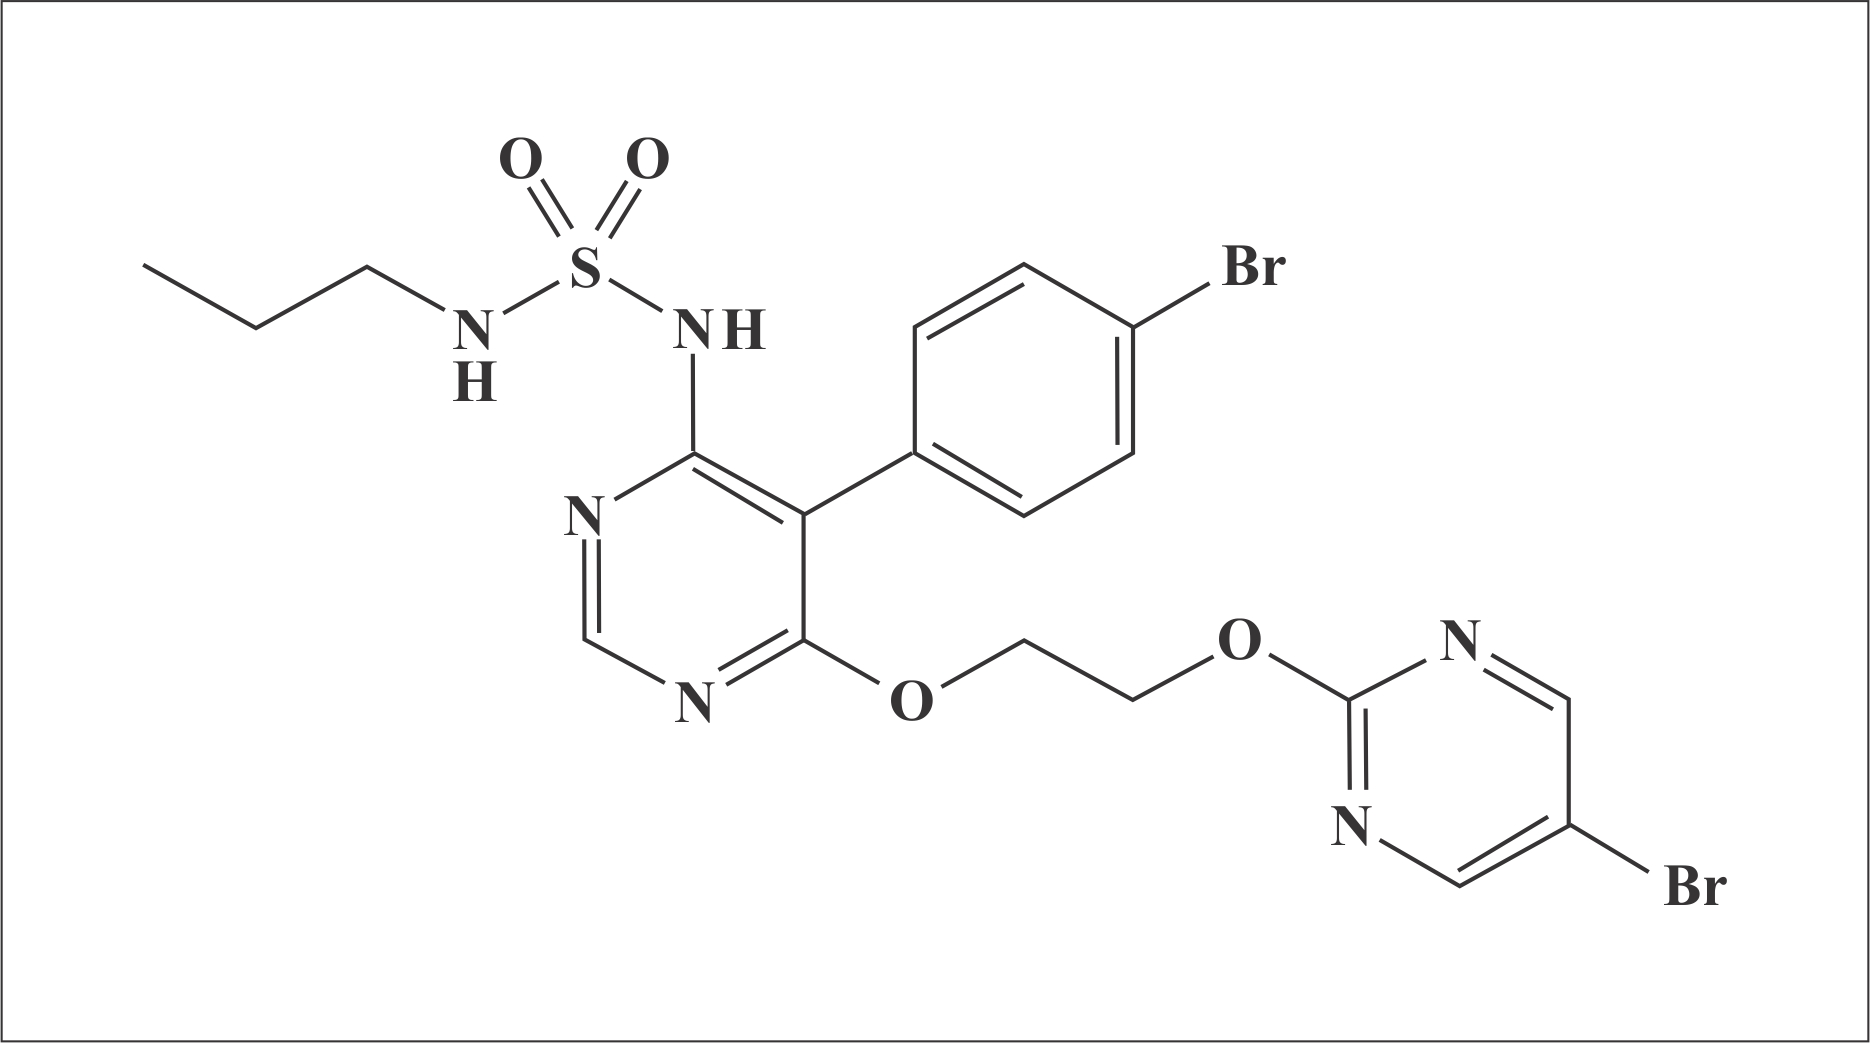
Structure (Macitentan Structure)

Structure (Macitentan Structure)
Chemical structure diagram of the active ingredient macitentan, showing the arrangement of atoms and bonds including rings, oxygen, nitrogen, sulfur, and bromine elements.*

* About these descriptions: Image descriptions on this page are generated by automated AI analysis of the product label images from the manufacturer's FDA label submission (SPL). They are provided for reference only and may contain errors or omissions. Always rely on the printed label itself and the official FDA labeling, and consult a pharmacist or healthcare professional with any questions about this product.