Carton Label (39aadc39 0f4f 44f7 88de 83a0ea2ac332 00)
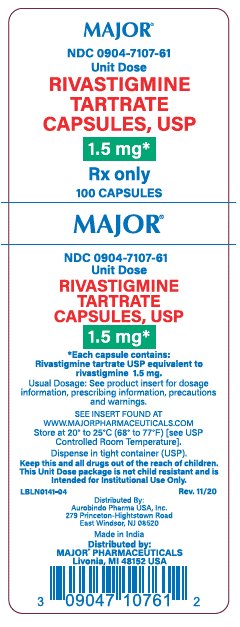
This is a medication description for RIVASTIGMINE TARTRATE capsules, USP by Major Pharmaceuticals. Each unit dose pack contains 100 capsules. The dosage instructions and precautions are not available due to unclear text. The product is only available with a prescription.*