Divalproex Sodium
Product Images NDC 0904-7181

View Photos of Packaging, Regulatory Labels, and Product Appearance

Product Visual Gallery

This gallery contains 6 technical images submitted to the FDA as part of the official labeling for Divalproex Sodium (NDC 0904-7181). Unlike standard consumer photos, these assets often include clinical data figures, molecular chemical structures, and official manufacturer packaging layouts.

As provided by Major Pharmaceuticals, these visuals offer a comprehensive scientific overview of the product's physical and chemical identity, aiding pharmacists and researchers in product verification and study.

FDA Label Image

Carton Label (Ef472176 7f98 4f88 Be5e A101fecb46fd 00)
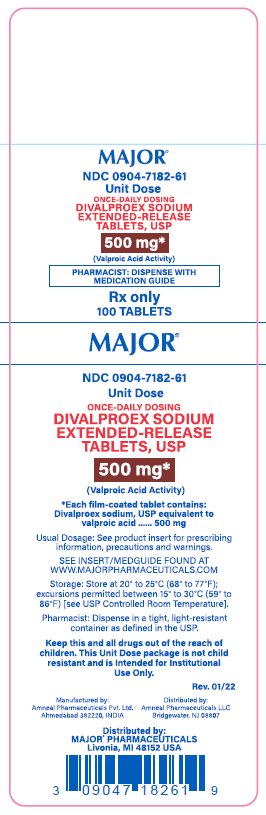
Carton Label (Ef472176 7f98 4f88 Be5e A101fecb46fd 00)
The label for Major Pharmaceuticals Divalproex Sodium Extended-Release Tablets, USP shows a strength of 500 mg per tablet in a unit dose package. It states the product contains 100 tablets for Rx only. The label provides storage instructions, manufacturer and distributor information, and dosing guidance emphasizing institutional use only.*
FDA Label Image

Carton Label (Ef472176 7f98 4f88 Be5e A101fecb46fd 01)

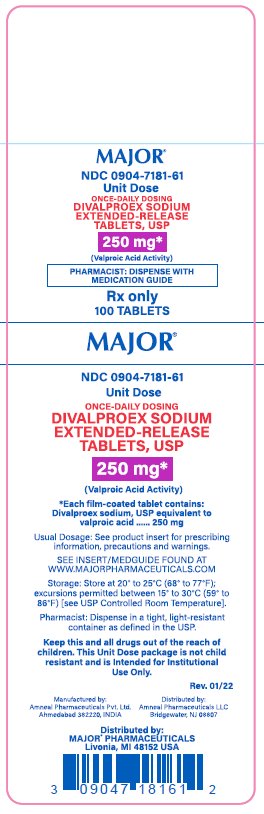
Carton Label (Ef472176 7f98 4f88 Be5e A101fecb46fd 01)
Label for Major Pharmaceuticals Divalproex Sodium extended-release tablets, USP, 250 mg strength. The package contains 100 tablets and is labeled as Rx only with unit dose packaging. The label includes usage instructions, storage conditions, and manufacturer and distributor information.*
FDA Label Image

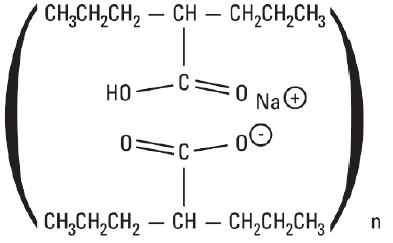
10 (Divalproex Sodium Extended Release Tablets Usp 1)

10 (Divalproex Sodium Extended Release Tablets Usp 1)
Chemical structure of divalproex sodium, showing the molecular arrangement with sodium ions and hydrocarbon chains.*
FDA Label Image

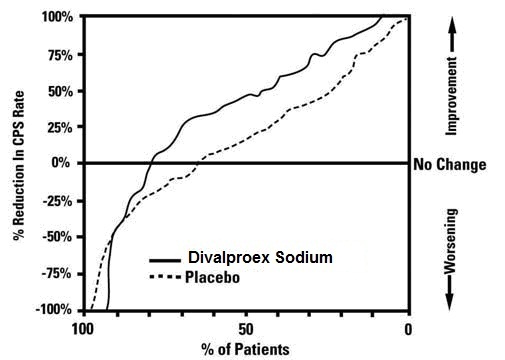
Figure 1 (Divalproex Sodium Extended Release Tablets Usp 2)

Figure 1 (Divalproex Sodium Extended Release Tablets Usp 2)
A cumulative distribution plot comparing percent reduction in CPS rate (vertical axis) against percent of patients (horizontal axis) for Divalproex Sodium versus placebo. The chart shows patient improvement or worsening, with Divalproex Sodium depicted by a solid line and placebo by a dashed line.*
FDA Label Image

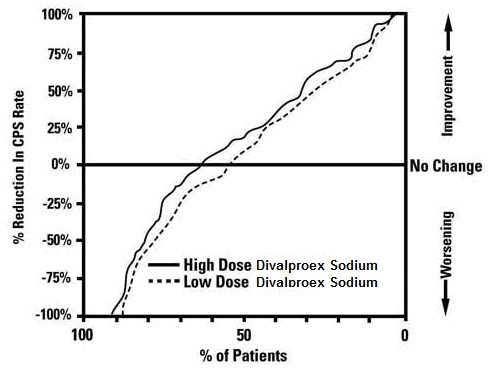
Figure 2 (Divalproex Sodium Extended Release Tablets Usp 3)

Figure 2 (Divalproex Sodium Extended Release Tablets Usp 3)
A cumulative distribution plot depicting the percentage reduction in CPS (Complex Partial Seizure) rate versus the percentage of patients for Divalproex Sodium. The graph compares high dose and low dose effects, with high dose shown by a solid line and low dose by a dashed line. The vertical axis ranges from -100% to 100% reduction, indicating worsening or improvement, and the horizontal axis shows the percentage of patients from 0 to 100%.*
FDA Label Image

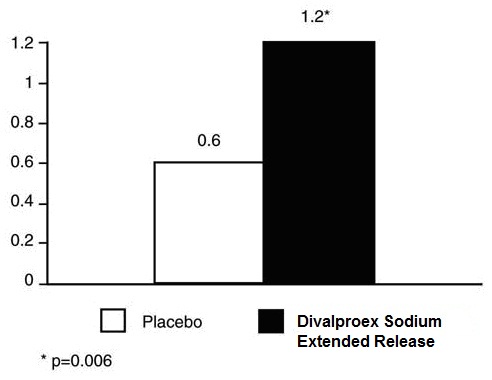
Figure 3 (Divalproex Sodium Extended Release Tablets Usp 4)

Figure 3 (Divalproex Sodium Extended Release Tablets Usp 4)
A bar graph comparing placebo and Divalproex Sodium Extended Release, showing numerical values on the y-axis with a statistically significant difference indicated (p=0.006). The placebo bar is lower than the Divalproex Sodium Extended Release bar, which is filled in black.*

* About these descriptions: Image descriptions on this page are generated by automated AI analysis of the product label images from the manufacturer's FDA label submission (SPL). They are provided for reference only and may contain errors or omissions. Always rely on the printed label itself and the official FDA labeling, and consult a pharmacist or healthcare professional with any questions about this product.