Sevoflurane Liquid
Product Images NDC 10019-653

14 FDA label images from Baxter Healthcare Corporation · Packaging, Regulatory Labels, and Product Appearance

Product Visual Gallery

This gallery contains 14 technical images submitted to the FDA as part of the official labeling for Sevoflurane (NDC 10019-653). Unlike standard consumer photos, these assets often include clinical data figures, molecular chemical structures, and official manufacturer packaging layouts.

As provided by Baxter Healthcare Corporation, these visuals offer a comprehensive scientific overview of the product's physical and chemical identity, aiding pharmacists and researchers in product verification and study.

FDA Label Image

Structural Formula (Image 01)

Structural Formula (Image 01)
Chemical structure of Sevoflurane, showing a carbon atom bonded to hydrogen, trifluoromethyl groups, and a fluoromethoxy group.*
FDA Label Image

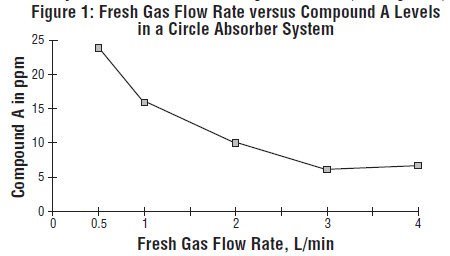
Figure 1: Fresh Gas Flow Rate Versus Compound A Levels In A Circle Absorber System (Image 02)

Figure 1: Fresh Gas Flow Rate Versus Compound A Levels In A Circle Absorber System (Image 02)
A line graph titled 'Fresh Gas Flow Rate versus Compound A Levels in a Circle Absorber System.' The graph plots Compound A concentration in ppm on the vertical axis against Fresh Gas Flow Rate in L/min on the horizontal axis, showing a generally decreasing trend with some variation at higher flow rates.*
FDA Label Image

Figure 2: Carbon Dioxide Flow Versus Compound A And Maximum Temperature (Image 03)

Figure 2: Carbon Dioxide Flow Versus Compound A And Maximum Temperature (Image 03)
A line graph depicting the relationship between carbon dioxide flow in mL/min on the x-axis and compound A concentration in ppm or maximum temperature in degrees Celsius on the y-axis. Two data sets are shown: compound A levels increase gradually, and maximum temperature rises more steeply as carbon dioxide flow increases, up to 400 mL/min.*
FDA Label Image

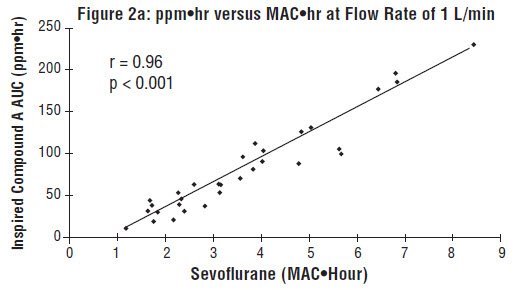
Figure 2a: Ppm ∙ Hr Versus Mac ∙ Hr At Flow Rate Of 1 L/min (Image 04)

Figure 2a: Ppm ∙ Hr Versus Mac ∙ Hr At Flow Rate Of 1 L/min (Image 04)
A scatter plot graph titled 'Figure 2a: ppm*hr versus MAC*hr at Flow Rate of 1 L/min,' showing the relationship between Sevoflurane exposure in MAC*Hour (x-axis) and Inspired Compound A AUC in ppm*hr (y-axis). The graph includes a trend line with a correlation coefficient (r) of 0.96 and a significance (p) value less than 0.001, indicating a strong positive correlation.*
FDA Label Image

Figure 3: Ratio Of Concentration Of Anesthetic In Alveolar Gas To Inspired Gas (Image 05)

Figure 3: Ratio Of Concentration Of Anesthetic In Alveolar Gas To Inspired Gas (Image 05)
A line graph titled 'Ratio of Concentration of Anesthetic in Alveolar Gas to Inspired Gas,' showing the concentration ratio over 30 minutes of administration for five anesthetic agents: Halothane, Isoflurane, Sevoflurane, Desflurane, and Nitrous Oxide (N2O). The y-axis ranges from 0 to 1, and the x-axis shows time in minutes. Each anesthetic is represented by a distinct line and symbol, illustrating changes in alveolar to inspired gas concentration ratios during administration.*
FDA Label Image

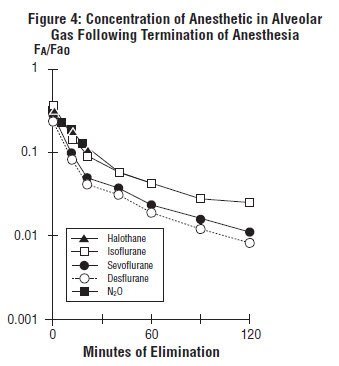
Figure 4: Concentration Of Anesthetic In Alveolar Gas Following Termination Of Anesthesia (Image 06)

Figure 4: Concentration Of Anesthetic In Alveolar Gas Following Termination Of Anesthesia (Image 06)
A line graph titled 'Concentration of Anesthetic in Alveolar Gas Following Termination of Anesthesia' plotting the ratio F_A/F_A0 against minutes of elimination up to 120 minutes. It compares the concentration decrease over time for several anesthetics including Halothane, Isoflurane, Sevoflurane, Desflurane, and Nitrous Oxide (N2O) using distinct symbols for each agent.*
FDA Label Image

Figure 5: Serum Inorganic Fluoride Concentration For Sevoflurane And Other Volatile Anesthetics (Image 07)

Figure 5: Serum Inorganic Fluoride Concentration For Sevoflurane And Other Volatile Anesthetics (Image 07)
Line graph showing serum inorganic fluoride concentration (µM) over days post-anesthesia for five volatile anesthetics: Methoxyflurane, Sevoflurane, Enflurane, Isoflurane, and Halothane. Data points include means and variability for each anesthetic, indicating trends in fluoride concentration from pre-anesthesia to 6 days post-anesthesia.*
FDA Label Image

Figure 6: Fluoride Ion Concentrations Following Administration Of Sevoflurane, Usp (Image 08)

Figure 6: Fluoride Ion Concentrations Following Administration Of Sevoflurane, Usp (Image 08)
A line graph depicting mean fluoride ion concentrations over time following administration of Sevoflurane, USP. The x-axis shows time in hours up to 50 hours, and the y-axis shows concentration in micromolar (µM) up to 70. The graph includes a solid line for mean concentration and three additional lines representing mean concentration plus one, two, and three standard deviations, respectively.*
FDA Label Image

Figure 7 (Heart Rate)

Figure 7 (Heart Rate)
A line graph titled 'Figure 7: Heart Rate' comparing heart rates (beats per minute) at baseline and various MAC levels (1, 1.5, 2, 2.5) under two conditions: Sevoflurane with oxygen (circle markers) and Sevoflurane with oxygen and nitrous oxide (triangle markers). The graph shows mean values with error bars for each condition and MAC level.*
FDA Label Image

Figure 8: Mean Arterial Pressure (Image 10)

Figure 8: Mean Arterial Pressure (Image 10)
Line graph titled 'Figure 8: Mean Arterial Pressure' showing mean arterial pressure (mmHg) on the Y-axis and MAC level (1 to 2.5) on the X-axis. Data points compare two groups: A (Sevo/O2) and C (Sevo/O2/N2O), starting from baseline and decreasing as MAC level increases.*
FDA Label Image

Figure 9: Systemic Vascular Resistance (Image 11)

Figure 9: Systemic Vascular Resistance (Image 11)
A line graph titled 'Figure 9: Systemic Vascular Resistance' showing the change in systemic vascular resistance (dyne-sec-cm-5) on the y-axis against MAC levels on the x-axis. The graph compares two groups: A (Sevo/O2) and C (Sevo/O2/N2O), with data points indicating a decreasing trend in systemic vascular resistance as MAC level increases from 1 to 2.*
FDA Label Image

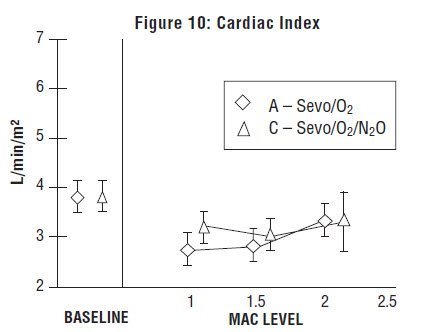
Figure 10: Cardiac Index (Image 12)

Figure 10: Cardiac Index (Image 12)
A line graph titled 'Figure 10: Cardiac Index' showing cardiac index values (L/min/m²) at different MAC levels, including baseline. Two lines represent data for Sevoflurane with oxygen (A - Sevo/O2) and Sevoflurane with oxygen and nitrous oxide (C - Sevo/O2/N2O). The graph includes markers with error bars indicating variability.*
FDA Label Image

Amerinet Choice Sevoflurane Representative Container Label (Image 13)

Amerinet Choice Sevoflurane Representative Container Label (Image 13)
Label for Sevoflurane, USP inhalation anesthetic liquid, 250 mL strength. The label states use by prescription only and includes storage instructions and manufacturer information for Baxter Healthcare Corporation and Amerinet Choice. It features a barcode and lot and expiration date fields.*
FDA Label Image

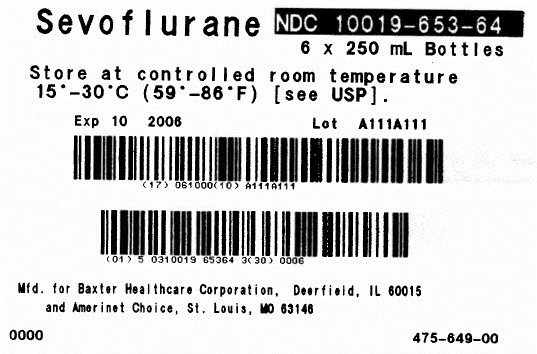
Sevoflurane Amerinet Choice Representative Carton Label (Image 14)

Sevoflurane Amerinet Choice Representative Carton Label (Image 14)
Label for Sevoflurane liquid inhalation by Baxter Healthcare Corporation. The label specifies a package of six 250 mL bottles, with storage instructions at controlled room temperature (15°-30°C). The label includes expiration and lot numbers, and barcodes for product identification.*

* About these descriptions: Image descriptions on this page are generated by automated AI analysis of the product label images from the manufacturer's FDA label submission (SPL). They are provided for reference only and may contain errors or omissions. Always rely on the printed label itself and the official FDA labeling, and consult a pharmacist or healthcare professional with any questions about this product.