Gabapentin
Product Images NDC 10135-647

View Photos of Packaging, Regulatory Labels, and Product Appearance

Product Visual Gallery

This gallery contains 7 technical images submitted to the FDA as part of the official labeling for Gabapentin (NDC 10135-647). Unlike standard consumer photos, these assets often include clinical data figures, molecular chemical structures, and official manufacturer packaging layouts.

As provided by Marlex Pharmaceuticals Inc, these visuals offer a comprehensive scientific overview of the product's physical and chemical identity, aiding pharmacists and researchers in product verification and study.

FDA Label Image

Gabapentin 600mg 100s
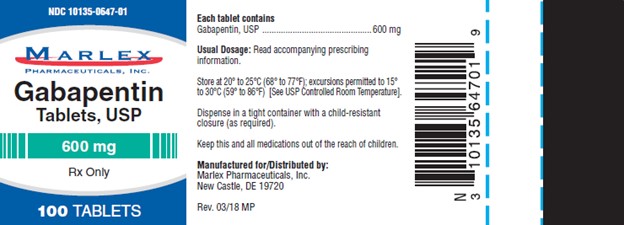
Gabapentin 600mg 100s
Gabapentin Tablets, USP 600 mg by Marlex Pharmaceuticals Inc. The label shows a 100-tablet package. It includes storage instructions, dosage caution, and child-resistant container advisory. The label also contains the manufacturer information and a barcode.*
FDA Label Image

Gabapentin 600mg 500s

Gabapentin 600mg 500s
Label for Gabapentin Tablets, USP 600 mg by Marlex Pharmaceuticals, Inc. The label indicates 500 tablets per container and includes dosage form, strength, manufacturer details, storage instructions, barcode, and a prescription-only note.*
FDA Label Image

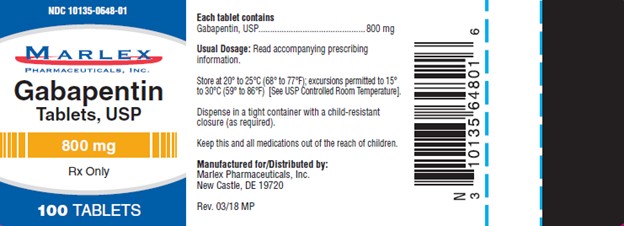
Gabapentin 800mg 100s

Gabapentin 800mg 100s
Gabapentin Tablets, USP 800 mg by Marlex Pharmaceuticals Inc is shown on a blue and white label. The package contains 100 tablets and indicates prescription use only (Rx Only). Storage instructions, dosage information, and manufacturer details including New Castle, DE address are visible, along with a barcode.*
FDA Label Image

Gabapentin 800mg 500s

Gabapentin 800mg 500s
Label for Gabapentin Tablets, USP 800 mg by Marlex Pharmaceuticals Inc. The label indicates the tablet strength of 800 mg and a package size of 500 tablets. It includes storage instructions, dispensing requirements, and directs users to prescribing information for dosage details. The label also shows the NDC number 10135-0648-05 and manufacturer/distributor information.*
FDA Label Image

Creatinine Clearance (clcr) Is Difficult To Measure In Outpatients. In Patients With Stable Renal Function, Creatinine Clearance Can Be Reasonably Well Estimated Using The Equation Of Cockcroft And Gault: (Gabapentin Tablets 01)

Creatinine Clearance (clcr) Is Difficult To Measure In Outpatients. In Patients With Stable Renal Function, Creatinine Clearance Can Be Reasonably Well Estimated Using The Equation Of Cockcroft And Gault: (Gabapentin Tablets 01)
Illustration of the formula for calculating creatinine clearance (CLCr), including factors for age, weight, serum creatinine, and a multiplier for female patients. This formula assists in estimating kidney function.*
FDA Label Image

The Structural Formual For Gabapentin, Usp Is A White To Off-white Crystalline Solid With A Pka1 Of 4.72±0.10 And A Pka2 Of 10.27±0.29. It Is Freely Soluble In Water And Both Basic And Acidic Aqueous Solutions. The Log Of The Partition Coefficient Is -1.083±0.235 At 25°c Temperature. (Gabapentin Tablets 02)

The Structural Formual For Gabapentin, Usp Is A White To Off-white Crystalline Solid With A Pka1 Of 4.72±0.10 And A Pka2 Of 10.27±0.29. It Is Freely Soluble In Water And Both Basic And Acidic Aqueous Solutions. The Log Of The Partition Coefficient Is -1.083±0.235 At 25°c Temperature. (Gabapentin Tablets 02)
Chemical structure diagram of Gabapentin showing its 3D molecular structure with annotated functional groups including the amino group (CH2NH2) and carboxyl group (CH2CO2H).*
FDA Label Image

In Two Of The Three Controlled Studies, More Than One Dose Of Gabapentin Was Used. Within Each Study, The Results Did Not Show A Consistently Increased Response To Dose. However, Looking Across Studies, A Trend Toward Increasing Efficacy With Increasing Dose Is Evident (see Figure 4). (Gabapentin Tablets 03)

In Two Of The Three Controlled Studies, More Than One Dose Of Gabapentin Was Used. Within Each Study, The Results Did Not Show A Consistently Increased Response To Dose. However, Looking Across Studies, A Trend Toward Increasing Efficacy With Increasing Dose Is Evident (see Figure 4). (Gabapentin Tablets 03)
A scatter plot graph showing urinary excretion percentage on the y-axis versus daily dose in mg on the x-axis, comparing three different studies labeled as STUDY a, STUDY b, and STUDY c, represented by different colored squares. Data points are plotted at daily doses of 600, 900, 1200, and 1800 mg with annotations a, b, and c near some points.*

* About these descriptions: Image descriptions on this page are generated by automated AI analysis of the product label images from the manufacturer's FDA label submission (SPL). They are provided for reference only and may contain errors or omissions. Always rely on the printed label itself and the official FDA labeling, and consult a pharmacist or healthcare professional with any questions about this product.