Tamsulosin Hydrochloride
Product Images NDC 10544-280

View Photos of Packaging, Regulatory Labels, and Product Appearance

Product Visual Gallery

This gallery contains 7 technical images submitted to the FDA as part of the official labeling for Tamsulosin Hydrochloride (NDC 10544-280). Unlike standard consumer photos, these assets often include clinical data figures, molecular chemical structures, and official manufacturer packaging layouts.

As provided by Blenheim Pharmacal, Inc., these visuals offer a comprehensive scientific overview of the product's physical and chemical identity, aiding pharmacists and researchers in product verification and study.

FDA Label Image

Label (Label Tamsulosin Hci Caps 0 4mg Bpi(10544 280 30) Activas(0228 2996 11) Rev1 Copy)

Label (Label Tamsulosin Hci Caps 0 4mg Bpi(10544 280 30) Activas(0228 2996 11) Rev1   Copy)
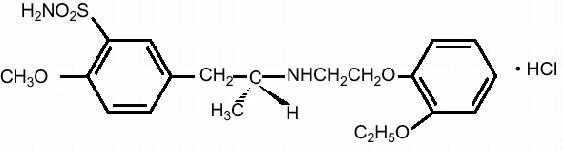
This is a label of Tamsulosin Hydrochloride Capsules, USP with a concentration of 0.4mg per capsule. The package contains 30 capsules, and it is for prescription-only use. Dosage details can be found in the package insert. The capsules should be stored at a controlled room temperature between 25°C (77°F), with permissible excursions to 15-30°C (59-86°F). The lot and expiration date are also available, along with the brand and manufacturer information. Overall, this label provides important information that can be used to ensure safe and appropriate use of the medication.*
FDA Label Image

Ab8b786d-figure-01 (Ab8b786d Figure 01)

FDA Label Image

Ab8b786d-figure-02 (Ab8b786d Figure 02)

FDA Label Image

Ab8b786d-figure-03 (Ab8b786d Figure 03)

FDA Label Image

Ab8b786d-figure-04 (Ab8b786d Figure 04)

Ab8b786d-figure-04 (Ab8b786d Figure 04)
This appears to be a table showing the results of a treatment study. The top row shows symbols that may be indicating specific data points or variables. The left column shows the duration of treatment in weeks, and the other cells contain numeric data for the treatment outcome at that time point. Without additional context, it is difficult to provide further information or interpretation of this data.*
FDA Label Image

Ab8b786d-figure-05 (Ab8b786d Figure 05)

Ab8b786d-figure-05 (Ab8b786d Figure 05)
This text describes a medical study or experiment with two different treatments, one labeled as "0.8 Mg D" and the other blank labeled as "Placebo." The results are presented in a chart showing data points for different weeks of treatment on the x-axis and "mUisec" (likely a measurement or metric) on the y-axis. There are eleven weeks represented in the chart, with data points for both treatments at weeks 1, 2, 7, 10, 13, and beyond. There are also notes about the number of participants in the study at different points, with the total number represented as 756. The purpose or context of the study is not available from the given text.*
FDA Label Image

Ab8b786d-figure-06 (Ab8b786d Figure 06)

Ab8b786d-figure-06 (Ab8b786d Figure 06)
This appears to be a chart or graph showing the treatment and duration of a study with some medication labeled "Bmg Lyelenls Ohmy". The chart shows different data points for the number of weeks of treatment and the number of participants (n) in the study. However, the data is not entirely clear and may not be very useful without additional context.*

* These product label images have been analyzed using experimental machine learning. Please verify findings with the primary label text.