Oxybutynin Chloride
Product Images NDC 10544-518

4 FDA label images from Blenheim Pharmacal, Inc. · Packaging, Regulatory Labels, and Product Appearance

Product Visual Gallery

This gallery contains 4 technical images submitted to the FDA as part of the official labeling for Oxybutynin Chloride (NDC 10544-518). Unlike standard consumer photos, these assets often include clinical data figures, molecular chemical structures, and official manufacturer packaging layouts.

As provided by Blenheim Pharmacal, Inc., these visuals offer a comprehensive scientific overview of the product's physical and chemical identity, aiding pharmacists and researchers in product verification and study.

FDA Label Image

5mg 30ct (Label Oxybutynin Chloride Tabs 5mg Bpi(10544 518 30) Qualitest(0603 4975 32) Rev1)

5mg 30ct (Label Oxybutynin Chloride Tabs 5mg  Bpi(10544 518 30) Qualitest(0603 4975 32) Rev1)
Oxybutynin Chloride Tablets, USP 5mg label from Blenheim Pharmacal, Inc. The label indicates 30 tablets per package with prescription-only status. It includes NDC 10544-518-30, storage instructions (20°-25°C, keep out of reach of children), and manufacturing details with placeholder lot and expiration dates. Barcodes and peel-here sections are also visible.*
FDA Label Image

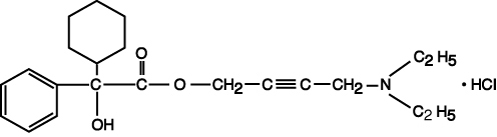
Structure (Oxybut 1)

Structure (Oxybut 1)
Chemical structure of oxybutynin hydrochloride, showing its molecular formula with distinct rings and chain components characteristic of the active ingredient oxybutynin chloride.*
FDA Label Image

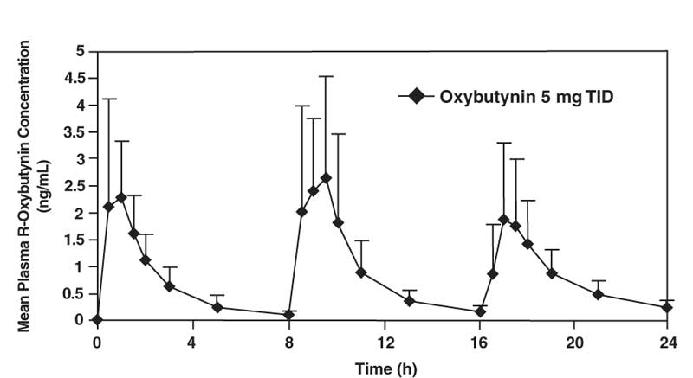
Figure 1 (Oxybut 2)

Figure 1 (Oxybut 2)
A line graph depicting mean plasma R-Oxybutynin concentration (ng/mL) over 24 hours after dosing with Oxybutynin 5 mg given three times daily (TID). The x-axis represents time in hours, and the y-axis shows concentration levels, with plotted points connected by a line and error bars indicating variability at each time point.*
FDA Label Image

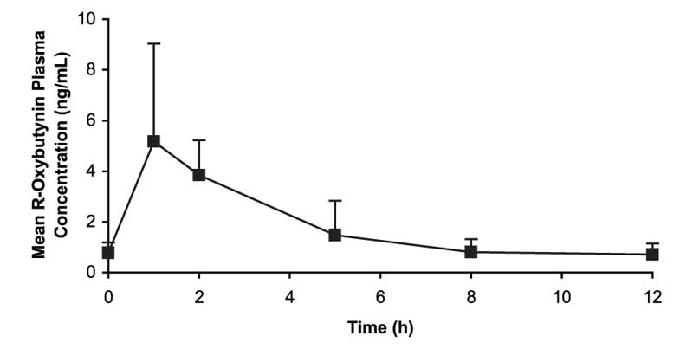
Figure 2 (Oxybut 3)

Figure 2 (Oxybut 3)
A line graph showing mean R-Oxybutynin plasma concentration (ng/mL) over time (hours). The y-axis ranges from 0 to 10 ng/mL, and the x-axis ranges from 0 to 12 hours. The concentration peaks near 5 ng/mL around 1 hour, then gradually decreases to below 2 ng/mL by 6 hours, and remains low up to 12 hours. Error bars indicate variability at each time point.*

* About these descriptions: Image descriptions on this page are generated by automated AI analysis of the product label images from the manufacturer's FDA label submission (SPL). They are provided for reference only and may contain errors or omissions. Always rely on the printed label itself and the official FDA labeling, and consult a pharmacist or healthcare professional with any questions about this product.